lighty.io UI: Network Topology Visualization Component
PANTHEON.tech had developed a network topology visualization component. Its main purpose is to develop a responsive and scalable front-end network topology visualization application on top of the lighty.io. The topology visualization component enables you to visualize any topology on any device with a web browser. It will also be included within the lighty.io distribution package.
We, as a successful software development company, were compelled to create our own solution based on the technologies we know and like to use. Other existing commercial applications fail to cover the visualization of the network topology sufficiently.
Watch our series of videos on the Visibility Package here
The experience of the development of Visibility Package, which is a software component, used to gather and visualize network topology data from different networks, network management systems, and cloud orchestrators, led PANTHEON.tech developers to create a better solution. Using this, the network topology visualization component will significantly reduce your time spent on development.
Check out our GitHub
We have developed the topology visualization component as an Angular component, which can be used in Angular applications to create network visualization applications. Thanks to its modularity, customizability the network visualization component can visualize any network from small company networks to large-scale data centers with thousands of nodes and links.
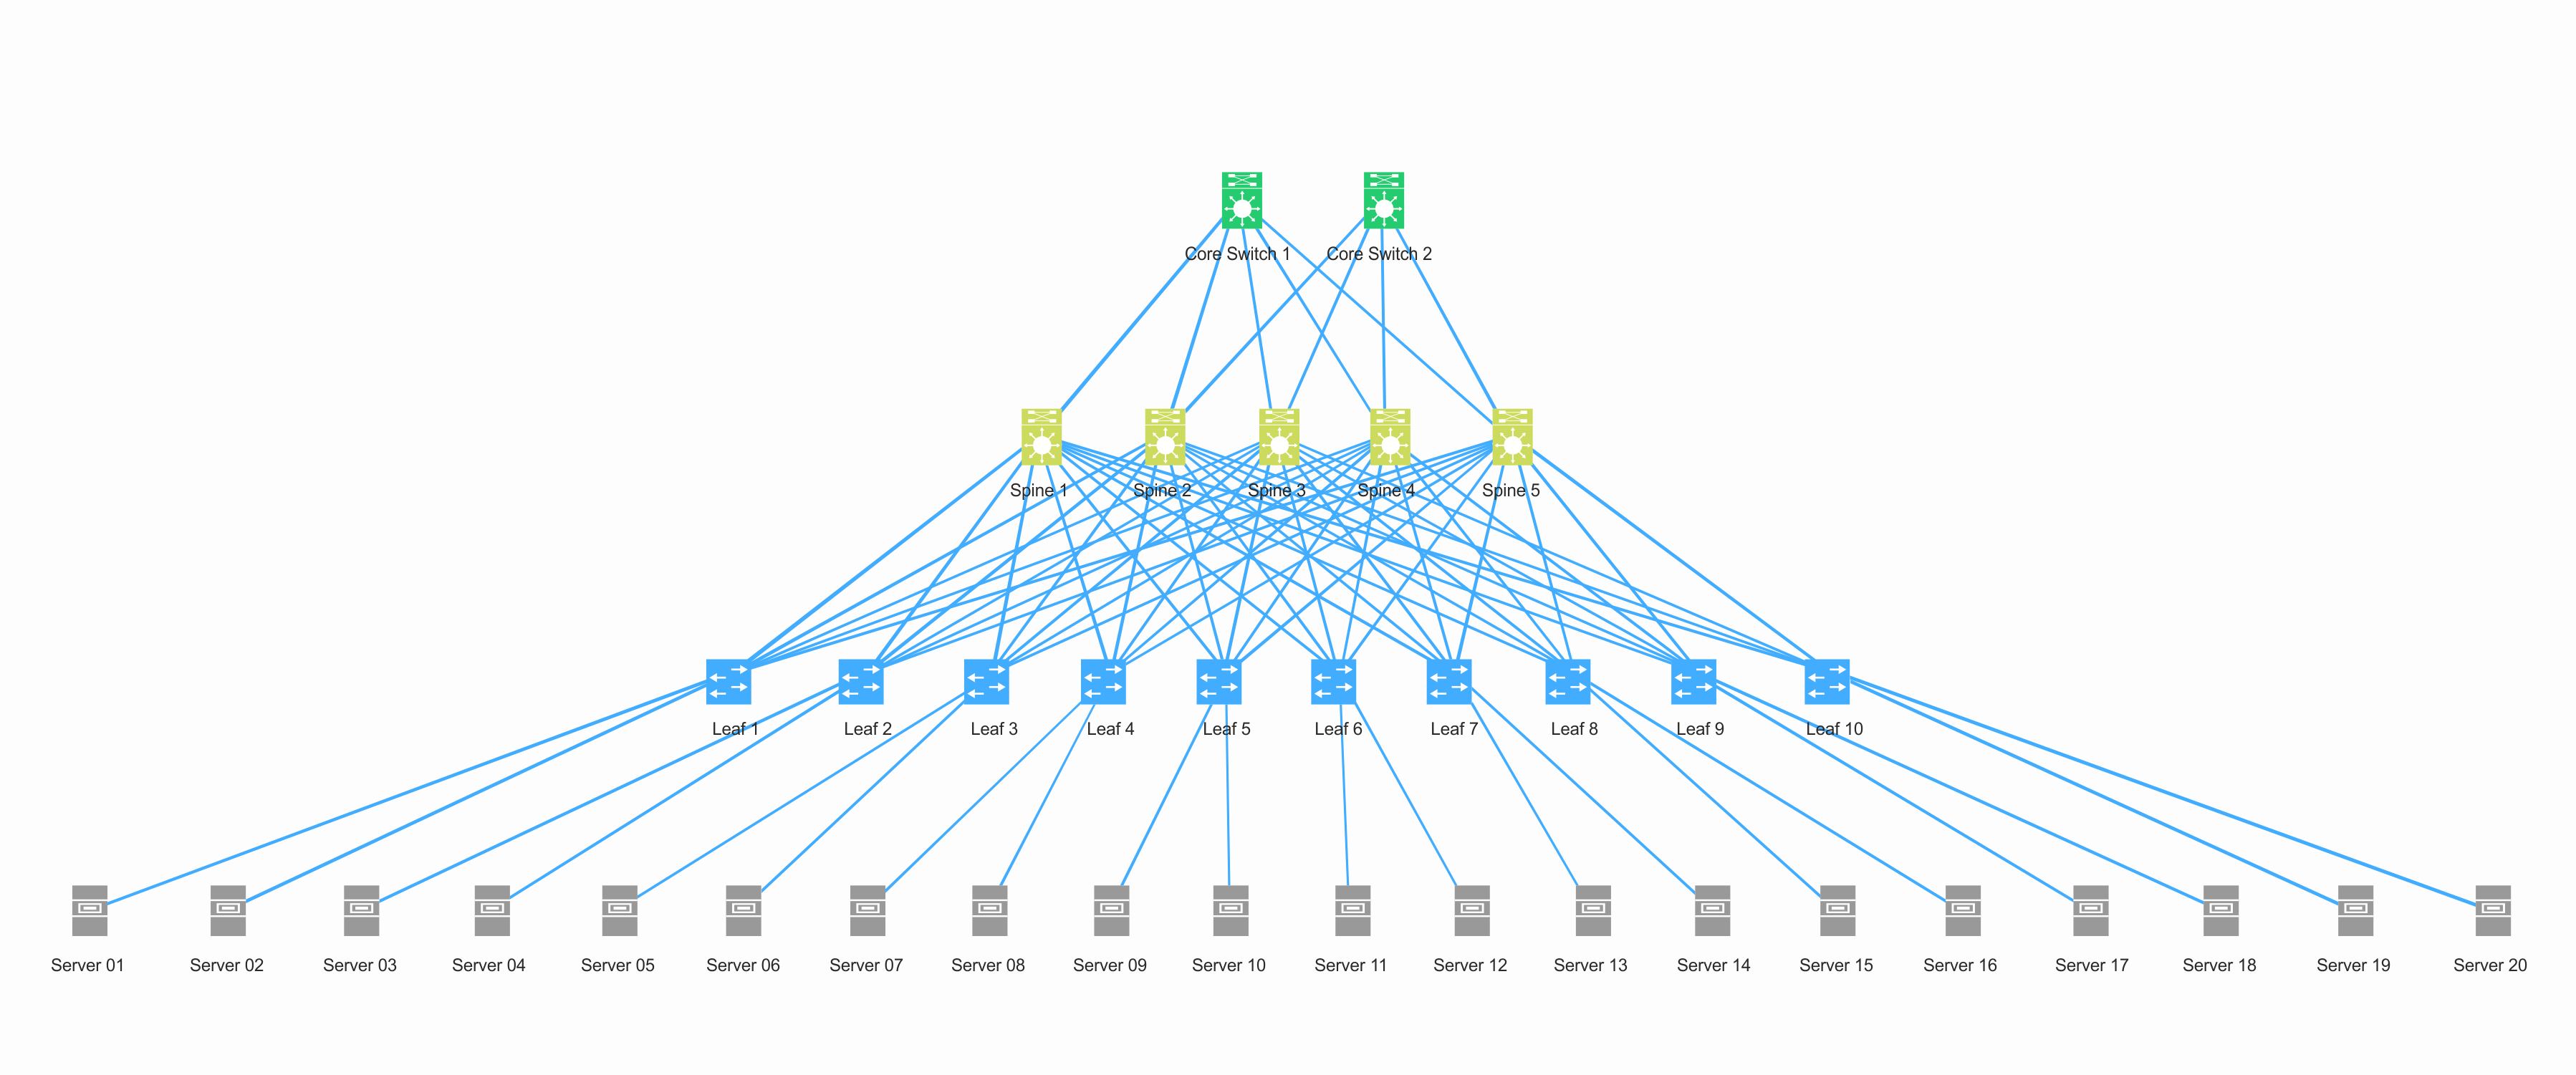
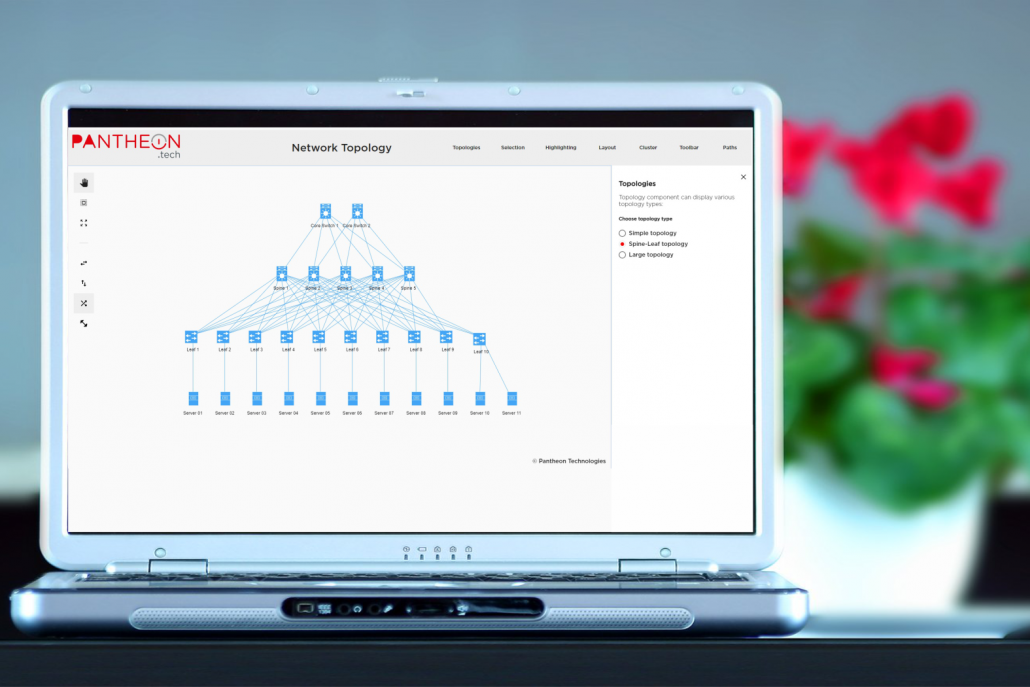
Picture(1): A screenshot of a spine-leaf network visualization sample.
As every use case’s demands, requirements, and scale widely differ from each other, a scalable and universal component was needed. That is why we have based the topology visualization component on the Angular framework, which allows rapid development of responsive, modular and scalable applications.
Our previous experiences showed us that SVG technology for topology visualization is not performing well with very large network topologies. That is why we decided to use HTML5 Canvas instead. Canvas provides seamless animations and has great responsiveness even with thousands of nodes and links.
Some of the great features of the topology visualization component are
- Ease of use
The topology visualization component includes extensive documentation and examples to help the developer while application creation. With Angular CLI, a basic application can be set up in minutes.
- Customizability
The basic application could easily be customized to the desired state. We have developed the topology visualization component with customization in mind.
- Modularity
The topology visualization component is developed as separate modules. The developer can decide and use which modules are needed for a particular project and add other modules whenever they are required.
- Speed & Responsiveness
Angular and HTML5 Canvas is used to ensure even with large amounts of data the application will be running effortlessly.
- Scalability
The topology visualization component works with small network topology with few nodes and links but truly shines with large-scale topologies. We are continually adding new features based on our client’s requests and needs. Watch this space out for many exciting features to be announced in the near future.

