by Martin Baláž | Subscribe to our newsletter!
PANTHEON.tech has contributed to another important milestone for the ODL community – OpenDaylight Performance Testing.
You might have seen our recent contribution to the ONAP CPS component, were focused on performance testing as well. Our team worked tirelessly on enabling the OpenDaylight community to test the performance of their NETCONF implementation. More on that below.
NETCONF Performance Testing
To be able to manage hundreds or thousands of NETCONF enabled devices without any slowdown, performance plays a crucial role. The time needed to process requests regarding NETCONF devices causes additional latency in network workflow, therefore the controller needs to be able to process all incoming requests as fast as possible.
What is NETCONF?
The NETCONF protocol is a fairly simple mechanism, throughout which network devices can be easily managed. Also, configuration data information can be uploaded, edited, and retrieved as well.
NETCONF enables device exposure through a formal API (application programming interface). The API is then used by applications to send/receive configuration data sets either in full or partial segments.
The OpenDaylight controller supports the NETCONF protocol in two roles:
- as a server (Northbound plugin)
- as a client (Southbound plugin)
NETCONF & RESTCONF in OpenDaylight
The Northbound plugin is an alternative interface for MD-SAL. It gives users the capability to read and write data from the MD-SAL data store, to invoke its RPCs.
The Southbound plugin’s capability lies in connecting towards remote NETCONF devices. It exposes their configuration or operational datastores, RPCs, or notifications, as MD-SAL mounting points.
Mount points then allow applications or remote users, to interact with mounted devices via RESTCONF.
Scalability Tests
Scalability testing is a technique of measuring system reactions in terms of performance, with gradually increased demands. It expresses how well the system can undertake an increased amount of requests, and if upgrading computer hardware improves the overall performance. From the perspective of data centers, it is a very important property.
It is frequent. that the number of customers or amount of requests increases over time and the OpenDaylight controller needs to adapt to be able to cope with it.
Test Scenarios
There are four test scenarios. These scenarios involve both NETCONF plugins, northbound and southbound. Each of them is examined from the perspective of scalability. During all tests, the maximum OpenDaylight heap space was set to 8GB.
The setup we used was OpenDaylight Aluminium, with two custom changes (this and that). These are already merged in the newest Silicon release.
Southbound: Maximum Devices Test
The main goal of this test is to measure how many devices can be connected to the controller with a limited amount of heap memory. Simulated devices were initialized with the following set of YANG models:
- ietf-netconf-monitoring
- ietf-netconf-monitoring-extension (OpenDaylight extensions to ietf-netconf-monitoring)
- ietf-yang-types
- ietf-inet-types
Devices were connected by sending a large batch of configurations, with the ultimate goal of connecting as many devices as soon as possible, without waiting for the previous batch of devices to be fully connected.
The maximum number of NETCONF devices is set to 47.000. It is based on the fact, that ports used by NETCONF devices start at the value of 17.830 and gradually use up ports to the maximum value of ports on a single host – which is 65.535. This range contains 47.705 possible ports.
| Heap Size | Connection Batch Size | TCP Max Devices | TCP Execution Time | SSH Max Devices | SSH Execution time |
| 2GB | 1k | 47 000* | 14m 23s | 26 000 | 11m 5s |
| 2GB | 2k | 47 000* | 14m 21s | 26 000 | 11m 12s |
| 4GB | 1k | 47 000* | 13m 26s | 47 000* | 21m 22s |
| 4GB | 2k | 47 000* | 13m 17s | 47 000* | 21m 19s |
Table 1– Southbound scale test results
*- reached the maximum number of created simulated NETCONF devices, while running all devices on localhost
Northbound: Performance Test
This test tries to write l2fibs entries (ncmount-l2fib@2016-03-07.yang modeled) to the controller’s datastore, through the NETCONF Northbound plugin, as fast as possible.
Requests were sent two ways:
- Synchronously: Each next request was sent, after receiving an answer for the previous request.
- Asynchronously: Sending a request as fast as possible, without waiting for a response for any previous request. The time spent processing requests was calculated as a time interval between sending the first request and receiving a response for the last request.
| Clients | Client type | l2fib/req | total l2fibs | TCP performance | SSH performance |
| 1 | Sync | 1 | 100 000 | 1 413 requests/s
1 413 fibs/s |
887 requests/s
887 fibs/s |
| 1 | Async | 1 | 100 000 | 3 422 requests/s
3 422 fibs/s |
3 281 requests/s
3 281 fibs/s |
| 1 | Sync | 100 | 500 000 | 300 requests/s
30 028 fibs/s |
138 requests/s
13 810 fibs/s |
| 1 | Async | 100 | 500 000 | 388 requests/s
38 844 fibs/s |
378 requests/s
37 896 fibs/s |
| 1 | Sync | 500 | 1 000 000 | 58 requests/s
29 064 fibs/s |
20 requests/s
10 019 fibs/s |
| 1 | Async | 500 | 1 000 000 | 83 requests/s
41 645 fibs/s |
80 requests/s
40 454 fibs/s |
| 1 | Sync | 1 000 | 1 000 000 | 33 requests/s
33 230 fibs/s |
15 requests/s
15 252 fibs/s |
| 1 | Async | 1 000 | 1 000 000 | 41 requests/s
41 069 fibs/s |
39 requests/s
39 826 fibs/s |
| 8 | Sync | 1 | 400 000 | 8 750 requests/s
8 750 fibs/s |
4 830 requests/s
4 830 fibs/s |
| 8 | Async | 1 | 400 000 | 13 234 requests/s
13 234 fibs/s |
5 051 requests/s
5 051 fibs/s |
| 16 | Sync | 1 | 400 000 | 9 868 requests/s
9 868 fibs/s |
5 715 requests/s
5 715 fibs/s |
| 16 | Async | 1 | 400 000 | 12 761 requests/s
12 761 fibs/s |
4 984 requests/s
4 984 fibs/s |
| 8 | Sync | 100 | 1 600 000 | 573 requests/s
57 327 fibs/s |
366 requests/s
36 636 fibs/s |
| 8 | Async | 100 | 1 600 000 | 572 requests/s
57 234 fibs/s |
340 requests/s
34 044 fibs/s |
| 16 | Sync | 100 | 1 600 000 | 545 requests/s
54 533 fibs/s |
355 requests/s
35 502 fibs/s |
| 16 | Async | 100 | 1 600 000 | 542 requests/s
54 277 fibs/s |
328 requests/s
32 860 fibs/s |
Table 2 – Northbound performance test results
Northbound: Scalability Tests
In terms of scalability, the NETCONF Northbound plugin was tested from two perspectives.
First, how well can OpenDaylight sustain performance (number of processed requests per second), while increasing the total amount of sent requests? Tests were executed in both variants, sending requests synchronously and also asynchronously.
In this scenario, it is desired, that the performance would be held around a constant value during all test cases.
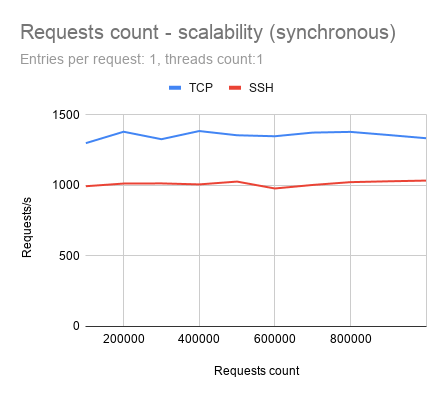
Diagram 1: NETCONF Northbound requests count scalability (synchronous)
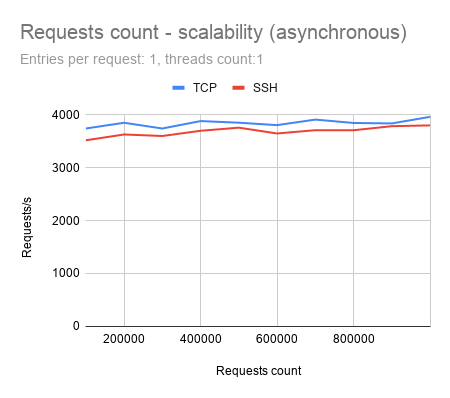
Diagram 2: NETCONF Northbound requests count scalability (asynchronous)
In the second case, we examined, how much time is needed to process all requests, affected by gradually increased request size (amount of elements sent within one request).
It is desired, that the total time needed to process all requests would be equal, or smaller, than the direct proportion of request size.
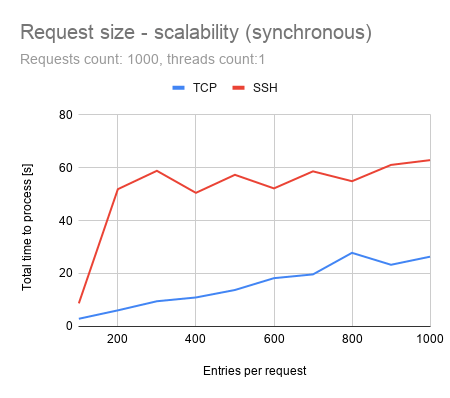
Diagram 3: NETCONF Northbound request size scalability (synchronous)
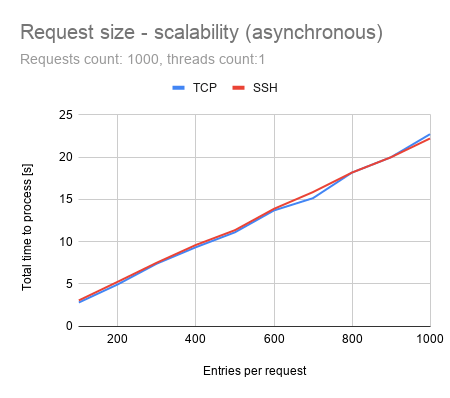
Diagram 4: NETCONF Northbound request size scalability (asynchronous)
Southbound: Performance Test
The purpose of this test is to measure, how many notifications, containing prefixes, can be received within one second.
All notifications were sent from a single NETCONF simulated device. No further processing of these notifications was done, except for counting received notifications, which was needed to calculate the performance results.
The model of these notifications is example-notifications@2015-06-11.yang. The time needed to process notifications is calculated as the time interval between receiving first the notification and receiving the last notification.
All notifications are sent asynchronously, while there are no responses for NETCONF notifications.
| Prefixes/Notifications | Total Prefixes | TCP Performance | SSH Performance |
| 1 | 100 000 | 4 365 notifications/s
4 365 prefixes/s |
4 432 notifications/s
4 432 prefixes/s |
| 2 | 200 000 | 3 777 notifications/s
7 554 prefixes/s |
3 622 notifications/s
7 245 prefixes/s |
| 10 | 1 000 000 | 1 516 notifications/s
15 167 prefixes/s |
1 486 notifications/s
14 868 prefixes/s |
Table 3 – Southbound performance test results
Southbound: Scalability Tests
Scalability tests for the Southbound plugin were executed similarly to tests from the Northbound plugin – running both scenarios. Results are calculated by examining changes in performance, caused by an increasing amount of notifications and the total time needed, to process all notifications, while increasing the number of entries per notification.
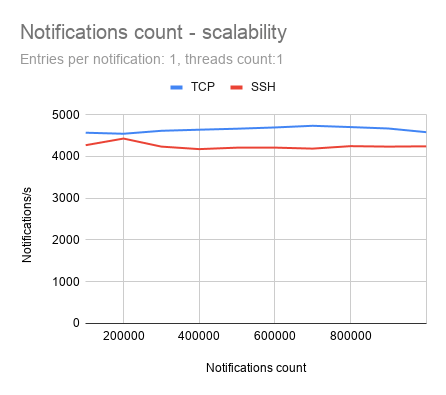
Diagram 5: NETCONF Southbound notifications count scalability
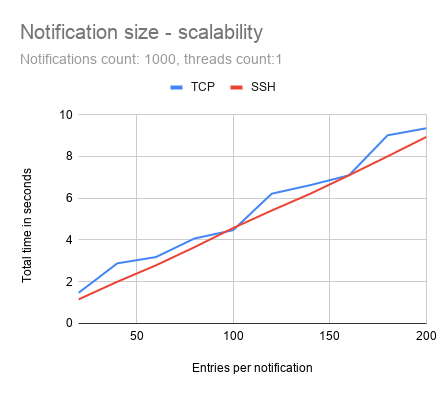
Diagram 6: NETCONF Southbound notifications size scalability
OpenDaylight E2E Performance Test
In this test, the client tries to write vrf-routes (modeled by Cisco-IOS-XR-ip-static-cfg@2013-07-22.yang) to NETCONF enabled devices via the OpenDaylight controller.
It sends vrf-routes via RESTCONF to the controller, using the specific RPC ncmount:write-routes. The controller is responsible for storing these data into the simulated devices, via NETCONF.
Requests were sent two ways:
- Synchronously: when each request was sent after receiving an answer for the previous request
- Asynchronously: sending multiple requests as fast as possible, while maintaining the maximum number of 1000 concurrent pending requests, for which response has not yet been received.
| Clients | Client type | prefixes/request | total prefixes | TCP performance | SSH performance |
| 1 | Sync | 1 | 20 000 | 181 requests/s
181 routes/s |
99 requests/s
99 routes/s |
| 1 | Async | 1 | 20 000 | 583 requests/s
583 routes/s |
653 requests/s
653 routes/s |
| 1 | Sync | 10 | 200 000 | 127 requests/s
1 271 routes/s |
89 requests/s
892 routes/s |
| 1 | Async | 10 | 200 000 | 354 requests/s
3 546 routes/s |
3 44 requests/s
3 444 routes/s |
| 1 | Sync | 50 | 1 000 000 | 64 requests/s
3 222 routes/s |
44 requests/s
2 209 routes/s |
| 1 | Async | 50 | 1 000 000 | 136 requests/s
6 812 routes/s |
138 requests/s
6 920 routes/s |
| 16 | Sync | 1 | 20 000 | 1 318 requests/s
1 318 routes/s |
424 requests/s
424 routes/s |
| 16 | Async | 1 | 20 000 | 1 415 requests/s
1 415 routes/s |
1 131 requests/s
1 131 routes/s |
| 16 | Sync | 10 | 200 000 | 1 056 requests/s
10 564 routes/s |
631 requests/s
6313 routes/s |
| 16 | Async | 10 | 200 000 | 1 134 requests/s
11 340 routes/s |
854 requests/s
8 540 routes/s |
| 16 | Sync | 50 | 1 000 000 | 642 requests/s
32 132 routes/s |
170 requests/s
8 519 routes/s |
| 16 | Async | 50 | 1 000 000 | 639 requests/s
31 953 routes/s |
510 requests/s
25 523 routes/s |
| 32 | Sync | 1 | 320 000 | 2 197 requests/s
2 197 routes/s |
921 requests/s
921 routes/s |
| 32 | Async | 1 | 320 000 | 2 266 requests/s
2 266 routes/s |
1 868 requests/s
1 868 routes/s |
| 32 | Sync | 10 | 3 200 000 | 1 671 requests/s
16 713 routes/s |
697 requests/s
6 974 routes/s |
| 32 | Async | 10 | 3 200 000 | 1 769 requests/s
17 696 routes/s |
1 384 requests/s
13 840 routes/s |
| 32 | Sync | 50 | 16 000 000 | 797 requests/s
39 854 routes/s |
356 requests/s
17 839 routes/s |
| 32 | Async | 50 | 16 000 000 | 803 requests/s
40 179 routes/s |
616 requests/s
30 809 routes/s |
| 64 | Sync | 1 | 320 000 | 2 293 requests/s
2 293 routes/s |
1 300 requests/s
1 300 routes/s |
| 64 | Async | 1 | 320 000 | 2 280 requests/s
2 280 routes/s |
1 825 requests/s
1 825 routes/s |
| 64 | Sync | 10 | 3 200 000 | 1 698 requests/s
16 985 routes/s |
1 063 requests/s
10 639 routes/s |
| 64 | Async | 10 | 3 200 000 | 1 709 requests/s
17 092 routes/s |
1 363 requests/s
13 631 routes/s |
| 64 | Sync | 50 | 16 000 000 | 808 requests/s
40 444 routes/s |
563 requests/s
28 172 routes/s |
| 64 | Async | 50 | 16 000 000 | 809 requests/s
40 456 routes/s |
616 requests/s
30 847 routes/s |
Table 4 – E2E performance test results
E2E Scalability Tests
These tests were executed just like the previous scale test cases – by increasing the number of requests and request size.
[av_gallery ids=’18294,18297,18291,18300′ style=’thumbnails’ preview_size=’portfolio’ crop_big_preview_thumbnail=’avia-gallery-big-crop-thumb’ thumb_size=’no scaling’ columns=’2′ imagelink=’avianolink noLightbox’ link_dest=” lightbox_text=’caption’ lazyload=’animations_off’ html_lazy_loading=’enabled’ alb_description=” id=” custom_class=” template_class=” av_uid=’av-id8ejg’ sc_version=’1.0′ admin_preview_bg=”]
Conclusion
The test results show good scalability of OpenDaylight in terms of keeping almost constant performance while processing larger requests and the ability to process a growing size of requests without decreasing final performance too much.
The only exceptions were cases when requests were sent synchronously using SSH protocol. There is a sudden, significant increase in processing time when request size exceeds the value of 100. The maximum number of connected devices shows good results within the ability to connect more than 47 000 devices with 4GB of RAM and 26 000 devices with 2GB of RAM.
By using the TCP protocol, those numbers are even higher. TCP protocol, in comparison with SSH, results as the faster one, but at the cost of many advantages that the SSH protocol brings, like data encryption, which would be critical for companies, which needs to keep their data safe.
Examining differences in performance between SSH and TCP protocol is part of further investigation and more parts on Performance Testing in OpenDaylight, so stay tuned and subscribed!

![[Case Study] Automating bandwidth optimization and SRTE policy management](https://pantheontech1.b-cdn.net/wp-content/uploads/2026/07/bandwith_auto.jpg)
![[Case Study] Engineering an SDN solution for a global vendor](https://pantheontech1.b-cdn.net/wp-content/uploads/2026/06/use-case-sdn.jpg)