This report reflects a series of metrics for last year and we are extremely proud to be highlighting our continued leading levels of participation and contribution in LFN’s technical communities. As an example, PANTHEON.tech provided over 60% of the commits to OpenDaylight in 2020.
This is an extraordinary achievement, given this is in the company of such accoladed peers as AT&T, Orange S.A., Cisco Systems Inc., Ericsson, and Samsung.
Customer Enablement
Clearly, this report demonstrates open source software solutions have secured themselves in many customer’s network architectures and strategies, with even more customers following this lead. Leveraging its expertise and experience, PANTHEON.tech, since its inception has been focused on offering customers; application development services, Enterprise-Grade tailored or productized open source solutions with an accompanying full support model
PANTHEON.tech leads the way in enabling customers with Software Defined Network automation, comprehensively integrating into an ecosystem of vendor and open orchestration, systems, and network devices across all domains of customer’s networks. Our solutions facilitate automation, for such services as O-RAN, L2/L3/E-VPN, 5G, or Data Centre, amongst many others.
Leveraging multiple open-source projects, including FD.io, we assist customers in embracing cloud-native, developing tailored enterprise-grade network functions, which focus on customer’s immediate and future requirements and performance objectives.
We help our customers unlock the potential of their network assets, whether; new, legacy, proprietary, open, multi-domain, or multi-layer, PANTHEON.tech has solutions to simplify and optimize customer’s networks, systems, and operations.
The key-takeaway is, that customers can rely on PANTHEON.tech to deliver, unlocking services in your existing networks, innovate and adopt new networks and services, while simplifying your operations.
Please contact PANTHEON.tech to discuss how we can assist your open-source network and application goals with our comprehensive range of services, subscriptions, and training.
At present, enterprises practice approaches in securing external perimeters of their networks. From centralized Virtual Private Networks (VPN), through access without a VPN to using solutions, such as EntGuard VPN.
That also means, that as an enterprise, you need to go the extra mile to protect your employees, your, and their data. A VPN will:
Encrypt your internet traffic
Protect you from data-leaks
Provide secure access to internal networks – with an extra layer of security!
Encrypt – Secure – Protect.
With EntGuard VPN, PANTHEON.tech utilized years of working on network technologies and software, to give you anenterprise-grade product, that is built for the cloud.
We decided to build EntGuard VPN on the critically-acclaimed WireGuard® protocol. The protocol focuses on ease-of-use & simplicity, as opposed to existing solutions like OpenVPN – while achieving incredible performance! Did you know that WireGuard® is natively supported in the Linux kernel and FD.io VPP since 2020?
WireGuard® is relied on for high-speeds and privacy protection. Complex, state-of-the-art cryptography, with lightweight architecture. An incredible combination.
Unfortunately, it’s not easy to maintain WireGuard® in enterprise environments, that’s why we have decided to bring you EntGuard, which gives you the ability to use WireGuard® tunnels in your enterprise environment.
Premium Features: Be the first to try out new features, such as – MFA, LDAP, Radius, end-station remote support, traffic monitoring, problem analysis and more!
The PANTHEON.tech, cloud-native network functions portfolio keeps on growing. At the start of 2020, we introduced you to the project, which at the moment houses 18 CNF’s. Make sure to keep up-to-date with our future products, by following us and our social media!
ONAP (Open Network Automation Platform) is quite a trend in the contemporary SDN world. It is a broad project, consisting of a variety of sub-projects (or components), which together form a network function orchestration and automation platform. Several enterprises are active in ONAP and its growth is accelerating rapidly. PANTHEON.tech is a proud contributor as well.
What is ONAP?
The platform itself emerged from the AT&T ECOMP (Enhanced Control, Orchestration, Management & Policy) and Open-O (Open Orchestrator) initiatives. ONAP is an open-source software platform, that offers a robust, real-time, policy-driven orchestration and automation framework, for physical and virtual network functions. It exists above the infrastructure layer, which automates the network.
ONAP enables end-users to connect services through the infrastructure. It allows network scaling and VNF/CNF implementations in a fully automated manner. Among other benefits, like:
Bring agile deployment & best practices to the telecom world
Add & deploy new features on a whim
Improve network efficiency & sink costs
Its goal is to enable operators and developers, networks, IT, and the cloud to quickly automate new technologies and support full lifecycle management. It is capable of managing (build, plan, orchestrate) Virtual Network Functions (VNF), as well as Software-Defined Networks (SDN).
ONAP’s high-level architecture involves numerous software subsystems (components). PANTHEON.tech is involved in multiple ONAP projects, but mostly around controllers (like SDN-C). For a detailed view, visit the official wiki page for the architecture of ONAP.
SDN-C
SDN-C is one of the components of ONAP – the SDN controller. It is basically OpenDaylight, with additional Directed Graph Execution capabilities. In terms of architecture, ONAP SDN-C is composed of multiple Docker containers.
Directed Graph Creator runs one of these containers. It’s a user-friendly web UI, that can be used to create directed graphs. Another container runs the Admin Portal. The next one runs the relational database, which is the focal point of the implementation of SDN-C and used for each container. Lastly, the SDN-C container, that runs the controller itself.
According to the latest 5G use-case paper for ONAP, SDN-C has managed to implement “radio-related optimizations through the SDN-R sub-project and support for the A1 interface”.
CDS: Controller Design Studio
As the official documentation puts it:
CDS Designer UI is a framework to automate the resolution of resources for instantiation and any config provisioning operation, such as day0, day1, or day2 configuration.
CDS has both design-time & run-time activities. During design time, the designer can define what actions are required for a given service, along with anything comprising the action. The design produces a CBA Package. Its content is driven by a catalog of reusable data dictionaries and components, delivering a reusable and simplified self-service experience.
CDS enables users to adapt resources in a way, where no direct code-changes are needed. The Design Studio gives users, not only developers, the option to customize the system, to meet the customer’s demands. The two main components of CDS are the frontend (GUI) and backend (run-time). It is possible to run CDS in Kubernetes or an IDE of your choice.
The primary role of SO is the automation of the provisioning operations of end-to-end service instances. In favor of overall end-to-end service instantiation, processes, and maintenance, SO is accountable for the instantiation and setup of VNFs.
To accomplish its purpose, Service Orchestration performs well-defined processes – usually triggered by receiving service requests, created by other ONAP components, or by Order Lifecycle Management in the BSS layer.
The orchestration procedure is either manually developed or received from ONAP’s Service Design and Development (SDC) portion, where all service designs are created for consumption and exposed/distributed.
The latest achievement of the Service Orchestrator is the implementation of new workflows such as:
CSMF – Communication Service Management Function
NSMF – Network Slice Management Function
NSSMF – Network Slice Sub-Net Management Function
DMaaP: Data Movement as a Platform
The DMaaP component is a data movement service, which transports and processes data from a selected source to the desired target. It is capable of transferring data and messages between ONAP components, data filtering/compression/routing, as well as message routing and batch/event-based processing.
DCAE: Data Collection Analytics & Events
The Data Collection Analytics & Events component does exactly what’s in its name – gather performance, usage & configuration data from the managed environment. The component guards events in a sense – if something significant occurs or an anomaly is detected, DCAE takes appropriate actions.
The component collects and stores data that is necessary for analysis while providing a framework for the development of needed analytics.
The Active & Available Inventory functionality offers real-time views of relationships with the products and services operated by them. It gives real-time insights into the managed products and services, as well as their connections.
A&AI is a list of properties that are active, available, and allocated. It establishes a multi-dimensional relationship between the programs and infrastructure under administration. It provides interfaces for dynamic network topology requests, both canned and ad-hoc network topology queries.
Recently AAI gained schema support for 5G service design and slicing models.
Is ONAP worth it?
Yes, it is. Since you have come up to this conclusion, then you might feel that ONAP is the right fit for your needs. It is an enormous project with around 20 components.
It is a long-term goal of several enterprises, including PANTHEON.tech, to embrace an open(-source) ecosystem for network development and connectivity.
An open approach to software development opens doors to all the talents around the globe, to contribute to projects that will shape the future of networking. One such project is the Open Radio Access Network or O-RAN for short.
Next In Line: O-RAN
Originally launched as OpenRAN, the project was started in 2017 by the Telecom Infra Project. The goal was to build a vendor-neutral, hardware & software-defined technology for 2-3-4G RAN solutions.
Then, the O-RAN Alliance was founded to increase community engagement, as well as to motivate operators to be included in this development. The alliance has made it a point, to create a standardization – meaning a description, of how this concept should function in reality.
O-RAN Architecture
O-RAN is part of the massive evolution from 4G networks, into the 5G generation. In 5G, due to higher bandwidths, more antenna and the use of multiple-input multiple-output (MIMO) technology, even more data needs to go back and forth.
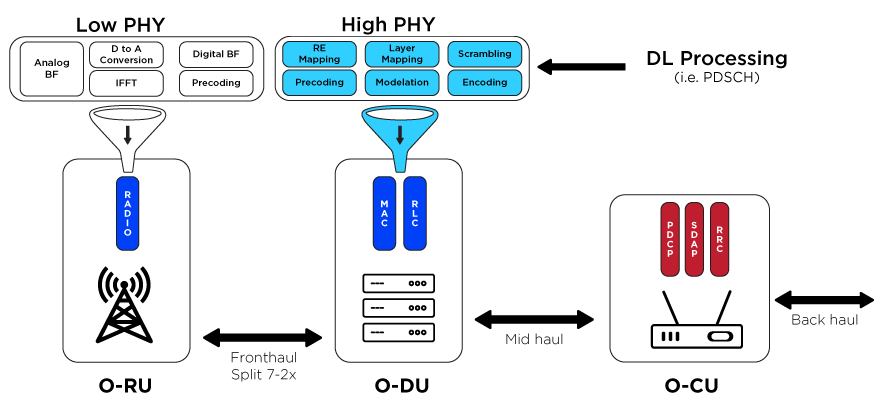
We can observe the formation of two solutions: the high-level split (HLS) and the low-level split (LLS). With so much of the processing shifting to the edge, the high-level split is a two-box solution. The F1 interface lies between the DU+RU and links to the centralized device. Alternatively, further processing is shifted to the middle by LLS and the antenna is held at the edge.
Three separate units are deployed with O-RAN:
O-RU: Radio Unit
O-DU: Distributed Unit
O-CU: Centralized Unit
At the edge sits the O-RU. In the center, the O-DU sits and performs some of the processing. Both HLS and LLS are included in O-RAN. They standardize the interfaces. For CUs, DUs, or RUs, operators may use different vendors. With one working group concentrating on the F1 interface and another on the front-haul, the components are much more interoperable and the protocols more clearly defined.
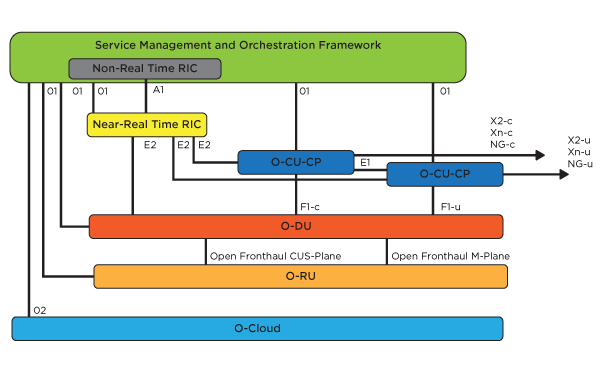
What’s more, O-RAN selected SDN-R as the project’s SDN controller. PANTHEON.tech is part of the SDN-R community.
What is a RAN?
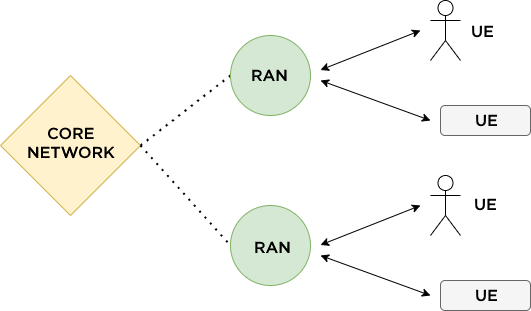
A radio access network implements radio access technology, which makes it able for user devices (anything able to receive this signal) to receive a connection to the core network, above the specific RAN.
A visual representation of core networks, radio access networks, and user devices.
The types of radio access networks include GSM, EDGE, and LTE standards, named GRAN, GERAN, E-UTRAN in that order.
The core network provides a path for information exchanging between subnetworks or different LANs. Imagine the core network as the backbone of an enterprise’s entire network.
The technology behind RANs is called RAT (radio access technology) and represents the principal technology behind radio-based communication. RATs include known network standards like GSM or LTE, or Bluetooth and WiFi.
Linux Foundation Networking Presents: O-RAN Software Community
In the first half of 2019, The Linux Foundation, in collaboration with the O-RAN Alliance, created the O-RAN Software Community, where members can contribute their knowledge & know-how to the O-RAN project.
Currently, the goal is to create a common O-RAN specification, that all RAN vendors would potentially adopt. This would mean a common interface, independent of the radio unit type.
This move certainly makes sense, since, at its core, O-RAN stands for openness – open-source, nonproprietary radio access networks. As the technical charter of the project puts it:
The mission of the Project is to develop open-source software enabling modular open, intelligent, efficient, and agile radio access networks, aligned with the architecture specified by O-RAN Alliance.
The further goal of creating a software community centered around this project is to include projects such as OPNFV, ONAP, and others, to create a complete package for future, open networking.
Join us in reminiscing and reminding you, what PANTHEON.tech has managed to create, participate in, or inform about in 2020.
Project: CDNF.io
In the first quarter of the year, we have made our latest project, CDNF.io, accessible to the public. Cloud-native functions were long overdue in our portfolio and let me tell you – there are lots of them, ready to be deployed anytime.
We have prepared a series of videos, centered around our CNFs, which you can conveniently view here:
Perhaps you like to read more than hear someone explain things to you? We wrote a few posts on:
Apart from our in-house solutions, we have worked on demonstrating several scenarios with common technologies behind them: ServiceNow® & Cisco’s Network Services Orchestrator.
In terms of ServiceNow®, our posts centered around:
Since we did not want to exclude people who might not be that knowledgable about what we do, we have created a few series on technologies and concepts PANTHEON.tech is engaged in, such as:
We try to listen closely to what Robert Varga, the top-single contributor to the OpenDaylight source-code, has to say about OpenDaylight. That allowed us to publish opinion/informative pieces like:
We would like to thank everybody who does their part in working and contributing to projects in PANTHEON.tech, but open-source projects as well. 2020 was challenging, to say the least, but pulling together, makes us stronger – together.
Happy holidays and new years to our colleagues, partners, and readers – from PANTHEON.tech.
These thoughts were originally sent on the public karaf-dev mailing list, where Robert Varga wrote a compelling opinion on what the future holds for Karaf and where its currently is headed. The text below was slightly edited from the original.
With my various OpenDaylight hats on, let me summarize our project-wide view, with a history going back to the project that was officially announced (early 2013).
From the get-go, our architectural requirement for OpenDaylight was OSGi compatibility. This means every single production (not maven-plugin obviously) artifact has to be a proper bundle.
This highly-technical and implementation-specific requirement was set down because of two things:
What OSGi brings to MANIFEST.MF in terms of headers and intended wiring, incl. Private-Package
Typical OSGi implementation (we inherited Equinox and are still using it) uses multiple class loaders and utterly breaks on split packages
This serves as an architectural requirement that translates to an unbreakable design requirement of how the code must be structured.
We started up with a home-brew OSGi container. We quickly replaced it for Karaf 3.0.x (6?), massively enjoying it being properly integrated, with shell, management, and all that. Also, feature:install.
At the end of the day, though, OpenDaylight is a toolkit of a bunch of components that you throw together and they work.
Our initial thinking was far removed from the current world of containers when operations go. The deployment was envisioned more like an NMS with a dedicated admin team (to paint a picture), providing a flexible platform.
The world has changed a lot, and the focus nowadays is on containers providing a single, hard-wired use-case.
We now also require Java 11, hence we have JPMS – and it can fulfill our architectural requirement just as well as OSGi. Thanks to OSGi, we have zero split packages.
We do not expect to ditch Karaf anytime soon, but rather leverage static-framework for a light-weight OSGi environment, as that is clearly the best option for us short-to-medium term, and definitely something we will continue supporting for the foreseeable future.
The shift to nimble single-purpose wirings is not going away and hence we will be expanding there anyway.
To achieve that, we will not be looking for a framework-of-frameworks, we will do that through native integration ourselves.
If Karaf can do the same, i.e. have its general-purpose pieces available as components, easily thrown together with @Singletons or @Components, with multiple frameworks, as well as nicely jlinkable – now that would be something.
From the get-go, the MD-SAL architecture was split into two distinct worlds: Binding-Independent (BI, DOM) and Binding-Aware (BA, Binding).
This split comes from two competing requirements:
Type-safety provided by Java, for application developers who interact with specific data models
Infrastructure services that are independent of data models.
Type-safety is supported by interfaces and classes generated from YANG models. It generally feels like any code, where you deal with DTOs.
Infrastructure services are supported by an object, model similar to XML DOM, where you deal with hierarchical “document” trees. All you have to go by, are QNames.
For obvious reasons, most developers interacting with OpenDaylight have never touched the Binding Independent world, even though it underpins pretty much every single feature available on the platform.
The old OpenDaylight SAL architecture looked like this:
A very dated picture of how the system is organized.
It is obvious that the two worlds need to seamlessly interoperate.
For example, RPCs invoked by one world, must be able to be serviced by the other. Since RPCs are the equivalent of a method call, this process needs to be as fast as possible, too.
That leads to a design, where each world has its own broker and the two brokers are connected. Invocations within the world would be handled by that world’s broker, foregoing any translation.
The Binding-Aware layer sits on top of the Binding Independent one. But it is not a one-to-one mapping.
This comes from the fact, that the Binding-Independent layer is centered around what makes sense in YANG, whereas the Binding-Aware layer is centered around what makes sense in Java, including various trade-offs and restrictions coming from them.
Binding-Aware: what makes sense in Java.
Binding-Independent: what makes sense in YANG.
Remote Procedure Calls
For RPCs, this meant that there were two independent routing tables, with repeated exports being done from each of them.
The idea of an RPC router was generalized in the (now long-forgotten) RpcRouter interface. Within a single node, the Binding & DOM routers would be interconnected.
For clustered scenarios, a connector would be used to connect the DOM routers across all nodes. So an inter-node Binding-Aware RPC request from node A to node B would go through:
Both the BI and connector speak the same language – hence they can communicate without data translation.
The design was simple and effective but has not survived the test of time. Most notably, the transition to dynamic loading of models in the Karaf container.
BA/BI Debacle: Solution
Model loading impacts data translation services needed to cross the BA/BI barrier, leading to situations where an RPC implementation was available in the BA world, but could not yet be exported to the BI world. This, in turn, leads to RPC routing loops, and in the case of data-store services – missing data & deadlocks.
To solve these issues, we have decided to remove the BA/BI split from the implementation and turn the Binding-Aware world into an overlay on top of the Binding-Independent world.
This means, that all infrastructure services always go through BI, and the Binding RPC Broker was gradually taken behind the barn, there was a muffled sound in 2015.
Welcome to Part 1 of the PANTHEON.tech Ultimate Guide to OpenDaylight! We will start off lightly with some tips & tricks regarding the tricky documentation, as well as some testing & building tips to speed up development!
Documentation
1. Website, Docs & Wiki
The differences between these three sources can be staggering. But no worries, we have got you covered!
OpenDaylight Docs – The holy grail for developers. The Docs page provides developers with all the important information to get started or go further.
OpenDaylight Wiki – A Confluence based wiki, for meeting minutes and other information, regarding the governance, projects structure, and other related stuff.
There are tens (up to hundreds) of mailing lists you can join, so you are up-to-date with all the important information – even dev talks, thoughts, and discussions!
DEV – 231 members – all projects development list with high traffic.
Release – 180 members – milestones & coordination of releases, informative if you wish to stay on top of all releases!
TSC – 236 members – the Technical Steering Committee acts as the guidance-council for the project
Testing & Building
1. Maven “Quick” Profile
There’s a “Quick” maven profile in most OpenDaylight projects. This profile skips a lot of tests and checks, which are unnecessary to run with each build.
This way, the build is much faster:
mvn clean install -Pq
2. GitHub x OpenDaylight
The OpenDaylight code is mirrored on GitHub! Since more people are familiar with the GitHub environment, rather than Gerrit, make sure to check out the official GitHub repo of ODL!
We have come a long way to enjoy all the benefits that cloud-native network functions bring us – lowered costs, agility, scalability & resilience. This post will break down the road to CNFs – from PNF to VNF, to CNF.
What are PNFs (physical network functions)?
Back in the ’00s, network functions were utilized in the form of physical, hardware boxes, where each box served the purpose of a specific network function. Imagine routers, firewalls, load balancers, or switches as PNFs, utilized in data centers for decades before another technology replaced them. PNF boxes were difficult to operate, install, and manage.
Just as it was unimaginable to have a personal computer 20 years ago, we were unable to imagine virtualized network functions. Thanks to cheaper, off-the-shelf hardware and expansion of cloud services, enterprises were able to afford to move some network parts from PNFs to generic, commodity hardware.
What are VNFs (virtual network functions)?
The approach of virtualization enabled us to share hardware resources between multiple tenants while keeping the isolation of environments in place. The next logical step was the move from the physical, to the virtual world.
A VNF is a virtualized network function, that runs on top of a hardware networking infrastructure. Individual functions of a network may be implemented or combined, in order to create a complete package of a networking-communication service. A virtual network function can be part of an SDN architecture or used as a singular entity within a network.
Cloud-native network functions are software implementations of functions, which are traditionally performed by PNFs – and they need to conform to cloud-native principles. They can be packaged within a container image, are always ready to be deployed & orchestrated, chained together to perform a series of complex network functions.
Why should I use CNFs?
Microservices and the overall benefits of adapting cloud-native principles, come with several benefits, which show a natural evolution of network functions in the 2020s. Imagine the benefits of:
Reduced Costs
Immediate Deployment
Easy Control
Agility, Scalability & Resilience
Our CNF project delivers on all of these promises. Get up-to-date with your network functions and contact us today, to get a quote.
This is a continuation of our guide on the Cisco Network Service Orchestrator. In our previous article, we have shown you how to install and run Cisco NSO with three virtual devices. We believe you had time to test it out and get to know this great tool.
Now, we will show you how to use the Cisco NSO with our SDN Framework – lighty.io. You can read more about lighty.io here, and even download lighty-core from our GitHub here.
Prerequisites
This tutorial was tested on Ubuntu 18.04 LTS. In this tutorial we are going to use:
After the build, locate the lighty-community-restconf-netconf-app artifact and unzip its distribution from the target directory:
cd lighty-examples/lighty-community-restconf-netconf-app/target
unzip lighty-community-restconf-netconf-app-11.2.0-bin.zip
cd lighty-community-restconf-netconf-app-11.2.0
Now we can start lighty.io application by running its .jar file:
After a few seconds we should see in the logs message that everything was started successfully:
INFO [main] (Main.java:97) - lighty.io and RESTCONF-NETCONF started in 7326.731ms
The lighty.io application should now be up and running. The default RESTCONF port is 8888.
Connect Cisco NSO to the lighty.io application
To connect Cisco NSO to the lighty.io application via NETCONF protocol we must add it as a node to the configuration datastore using RESTCONF. To do this, call a PUT request on the URI:
The parameter nodeIdspecifies the name, under which we will address Cisco NSO in the lighty.io application. Parameters host and port specify, where the Cisco NSO instance is running. The default username and password for Cisco NSO is admin/admin. In case you would like to change node-id be sure to change it in the URI too.
To check if Cisco NSO was connected successfully, call a GET request on the URI:
If Cisco NSO was connected successfully, the value of the connection-status should be connected.
Activate Cisco NSO service using lighty.io
Activation of the Cisco NSO service is similar to connecting Cisco NSO to lighty.io. We are going to activate the ACL service we created in the previous tutorial, by calling PUT REST request on URI:
This payload is modeled in a YANG model we created together with the ACL service in our previous tutorial. Feel free to change the values of the ACL parameters (first, check what types they are in the ACL service YANG model) and if you are changing ACL_Name, don’t forget to change it in the URI too.
Unfortunately, in the time of writing this tutorial, there is a bug in the OpenDaylight NETCONF (NETCONF-568) with parsing the output from this call. It prevents lighty.io from sending a response to the RESTCONF request we sent and we need to manually stop waiting for this response in Postman (or another REST client you are using).
Now, our service should be activated! To check activated services in Cisco NSO, call a GET request on the URI:
You can simulate hundreds or thousands of NETCONF devices within your development or CI/CD. We are of course talking about our lighty NETCONF Simulator, which is now available on GitHub! This tool is free & open-source, while based on OpenDaylight’s state-of-art NETCONF implementation.
We have recently finished the implementation of get-schema RPC from NETCONF Monitoring, which is based on the RFC 6022 by the IETF and brings users a missing monitoring possibility for NETCONF devices.
Let us know, what NETCONF device you would like to simulate!
What is a get-schema
Part of NETCONF Monitoring features is get-schema RPC, which allows the controller to download schemas from the NETCONF device to the controller, so they don’t have to be added manually.
In the points, one after another, the process of device connection looks like this (when controller and device are started):
1. Connection between NETCONF device and controller is established
2. When established and hello message capabilities exchanged, the controller requests a list of available models from the NETCONF device
3. When NETCONF device supports this feature, it sends its models to the controller
4. Controller then processes those models and builts schema context
In a more technical perspective, here is the process of connecting devices:
1. SSH connection from the controller to the NETCONF device is established
2. NETCONF device sends a hello message with its capabilities
3. Controller sends hello message with its capabilities
4. Controller requests (gets) a list of available schemas (models) from the NETCONF device datastore (ietf-netconf-monitoring:netconf-state/schemas)
5. NETCONF device sends a list of available schemas to the controller
6. controller goes through this list, download each model via get-schema RPC, and stores them in the cache/schema directory
7. Schema context is built in the controller from models in the cache/schema directory
How does the feature work in an enabled device?
In the device, there is a monitoring flag that can be set up with EnabledNetconfMonitoring(boolean) method. The feature is enabled by default. If the flag is enabled, when the device is built and then started, the device’s operational datastore is populated with schemas from the device’s schemaContext.
In our device, we use NetconfDevice implementation which is built with NetconfDeviceBuilder pattern. This feature is by default enabled and can be disabled by calling with NetconfMonitoringEnabled(false) on the NetconfDeviceBuilder, which sets a flag that netconf-monitoring will be enabled.
When the build() command is called on device builder, if that flag is set, the netconf-monitoring model is added to the device and is created NetconfDeviceImpl instance with a monitoring flag from the builder. Then, when the device is started, prepareSchemasForNetconfMonitoring is called if monitoring is enabled and the datastore is populated with schemas, which are then stored in the netconf-state/schemas path.
It is done via write transaction, where each module and submodule in the device’s schema context is converted to a schema and written into a map with schema key (if the map doesn’t already contain a schema with a given key) When the device is then connected to the controller, get-schema RPC will ask for each of these schemas in netconf-state/schemas path and download them to the cache/schema directory.
What is the purpose of the get-schema?
It helps to automate the device connection process. When a new device is connected, there is no need to manually find and add all models that the device supports in its capabilities, to the controller, but those are downloaded from the device by the controller.
[Example 1] NETCONF Monitoring schemas on our Toaster simulator device
To get a list of all schemas, it is needed to send a get request with a specified netconf-state/schemas path.
To get a particular schema with its content in YANG format, the following RPC is sent – an example of getting toaster schema, with revision version 2009-11-20. XML RPC request:
A DevOps paradigm, programmatic approach, or Kubernetes management. The decision between a declarative or imperative approach is not really a choice – which we will explain in this post.
The main difference between the declarative and imperative approach is:
Declarative: You will say what you want, but not how
Imperative: You describe howto do something
Declarative Approach
Users will mainly use the declarative approach when describing how services should start, for example: “I want 3 instances of this service to run simultaneously”.
In the declarative approach, a YAML file containing the wished configuration will be read and applied towards the declarative statement. A controller will then know about the YAML file and apply it where needed. Afterwards, the K8s scheduler will start the services, where it has the capacity to do so.
Kubernetes, or K8s for short, lets you decide between what approach you choose. When using the imperative approach, you will explain to Kubernetes in detail, how to deploy something. An imperative way includes the commands create, run, get & delete – basically any verb-based command.
Will I ever manage imperatively?
Yes, you will. Even when using declarative management, there is always an operator, which translates the intent to a sequence of orders and operations which he will do. Or there might be several operators who cooperate or split the responsibility for parts of the system.
Although declarative management is recommended in production environments, imperative management can serve as a faster introduction to managing your deployments, with more control over each step you would like to introduce.
Each approach has its pro’s and con’s, where the choice ultimately depends on your deployment and how you want to manage it.
While software-defined networking aims for automation, once your network is fully automated, enterprises should consider IBN (Intent-Based Networking) the next big step.
Intent-Based Networking (IBN)
Intent-Based Networking is an idea introduced by Cisco, which makes use of artificial intelligence, as well as machine learning to automate various administrative tasks in a network. This would be telling the network, in a declarative way, what you want to achieve, relieving you of the burden of exactly describing what a network should do.
For example, we can configure our CNFs in a declarative way, where we state the intent – how we want the CNF to function, but we do not care how the configuration of the CNF will be applied to, for example, VPP.
For this purpose, VPP-Agent will send the commands in the correct sequence (with additional help from KVscheduler), so that the configuration will come as close as possible to the initial intent.
For newcomers to our blog – welcome to a series on explanations from the world of PANTHEON.tech software development. Today, we will be looking at what software-defined networking is – what it stands for, it’s past, present, future – and more.
What is SDN – Software Defined Networking?
Networks can exponentially scale and require around the clock troubleshooting, in case something goes wrong – which always can. Software-Defined Networking is a concept of decluttering enterprises of physical network devices and replacing them with software. The goal is to improve the traditional network management and ease the entire process by removing pricey, easily obsolete hardware and replace it with their virtualized counterparts.
The core component is the control plane, which encompasses one (or several) controllers, like OpenDaylight. This makes centralization of the network a breeze and provides an overview of its entirety. The main benefits of utilizing SDN are:
Centralization
Open Standards
Scheduling
Most network admins can relate to the feeling when you have to manage multiple network devices separately, with different ones requiring proprietary software and making your network a decentralized mess. Utilizing SDN enables you to make use of a network controller and centralize the management, security, and other aspects of your network in one place.
Network topologies enable full control of the network flow. Bandwidth can be managed to go where it needs, but it does not end there – network resources, in general, can be secured, managed, and optimized, in order to accommodate current needs. Scheduling or programmability is what differs software-defined networking from a traditional network approach.
Open standards let you know, that you do not have to rely on one hardware provider, with vendor-specific protocols and devices. Projects, such as OpenDaylight, which has been around since 2013, with contributions from major companies like Orange, RedHat, but with leading contributions from PANTHEON.tech. Being an open-source project, you can rely on the community of expert technicians on perfecting the solution with each commit or pull request.
The idea of a software-defined network supposedly started at Stanford University, where researchers played with the idea of virtualizing the network. The idea was to virtualize the network by making the control plane and data plane two separate entities, independent of each other.
What is NFV – Network Function Virtualization?
On the other hand, NFV or Network Function Virtualization aims to replace hardware, which serves a specific purpose, with virtual network functions (Virtual Customer Premise Equipment – vCPE). Imagine getting rid of most proprietary hardware, the difficulty of upgrading each part, and making them more accessible, scalable, and centralized.
SDN & NFV go therefore hand-in-hand in most of the aspects covered, but mainly in the goal of virtualizing most parts of the network equipment or functions.
As for the future, PANTHEON.tech’s mission is to bring enterprises closer to a complete SDN & NFV coverage, with training, support, and custom network software that will make the transition easier. Contact us today – the future of networking awaits.
As part of a webinar, in cooperation with the Linux Foundation Networking, we have created two repositories with examples from our demonstration “Building CNFs with FD.io VPP and Network Service Mesh + VPP Traceability in Cloud-Native Deployments“:
Check out our full-webinar, in cooperation with the Linux Foundation Networking on YouTube:
What is Network Service Mesh (NSM)?
Recently, Network Service Mesh (NSM) has been drawing lots of attention in the area of network function virtualization (NFV). Inspired by Istio, Network Service Mesh maps the concept of a Service Mesh to L2/L3 payloads. It runs on top of (any) CNI and builds additional connections between Kubernetes Pods in the run-time, based on the Network Service definition deployed via CRD.
Unlike Contiv-VPP, for example, NSM is mostly controlled from within applications through the provided SDK. This approach has its pros and cons.
Pros: Gives programmers more control over the interactions between their applications and NSM
Cons: Requires a deeper understanding of the framework to get things right
Another difference is, that NSM intentionally offers only the minimalistic point-to-point connections between pods (or clients and endpoints in their terminology). Everything that can be implemented via CNFs, is left out of the framework. Even things as basic as connecting a service chain with external physical interfaces, or attaching multiple services to a common L2/L3 network, is not supported and instead left to the users (programmers) of NSM to implement.
Integration of NSM with Ligato
At PANTHEON.tech, we see the potential of NSM and decided to tackle the main drawbacks of the framework. For example, we have developed a new plugin for Ligato-based control-plane agents, that allows seamless integration of CNFs with NSM.
Instead of having to use the low-level and imperative NSM SDK, the users (not necessarily software developers) can use the standard northbound (NB) protobuf API, in order to define the connections between their applications and other network services in a declarative form. The plugin then uses NSM SDK behind the scenes to open the connections and creates corresponding interfaces that the CNF is then ready to use.
The CNF components, therefore, do not have to care about how the interfaces were created, whether it was by Contiv, via NSM SDK, or in some other way, and can simply use logical interface names for reference. This approach allows us to decouple the implementation of the network function provided by a CNF from the service networking/chaining that surrounds it.
The plugin for Ligato-NSM integration is shipped both separately, ready for import into existing Ligato-based agents, and also as a part of our NSM-Agent-VPP and NSM-Agent-Linux. The former extends the vanilla Ligato VPP-Agent with the NSM support while the latter also adds NSM support but omits all the VPP-related plugins when only Linux networking needs to be managed.
Furthermore, since most of the common network features are already provided by Ligato VPP-Agent, it is often unnecessary to do any additional programming work whatsoever to develop a new CNF. With the help of the Ligato framework and tools developed at Pantheon, achieving the desired network function is often a matter of defining network configuration in a declarative way inside one or more YAML files deployed as Kubernetes CRD instances. For examples of Ligato-based CNF deployments with NSM networking, please refer to our repository with CNF examples.
Finally, included in the repository is also a controller for K8s CRD defined to allow deploying network configuration for Ligato-based CNFs like any other Kubernetes resource defined inside YAML-formatted files. Usage examples can also be found in the repository with CNF examples.
CNF Chaining using Ligato & NSM (example from LFN Webinar)
In this example, we demonstrate the capabilities of the NSM agent – a control-plane for Cloud-native Network Functions deployed in a Kubernetes cluster. The NSM agent seamlessly integrates the Ligato framework for Linux and VPP network configuration management, together with Network Service Mesh (NSM) for separating the data plane from the control plane connectivity, between containers and external endpoints.
In the presented use-case, we simulate a scenario in which a client from a local network needs to access a web server with a public IP address. The necessary Network Address Translation (NAT) is performed in-between the client and the webserver by the high-performance VPP NAT plugin, deployed as a true CNF (Cloud-Native Network Functions) inside a container. For simplicity, the client is represented by a K8s Pod running image with cURL installed (as opposed to being an external endpoint as it would be in a real-world scenario). For the server-side, the minimalistic TestHTTPServer implemented in VPP is utilized.
In all the three Pods an instance of NSM Agent is run to communicate with the NSM manager via NSM SDK and negotiate additional network connections to connect the pods into a chain client:
Client <-> NAT-CNF <-> web-server (see diagrams below)ne
The agents then use the features of the Ligato framework to further configure Linux and VPP networking around the additional interfaces provided by NSM (e.g. routes, NAT).
The configuration to apply is described declaratively and submitted to NSM agents in a Kubernetes native way through our own Custom Resource called CNFConfiguration. The controller for this CRD (installed by cnf-crd.yaml) simply reflects the content of applied CRD instances into an ETCD datastore from which it is read by NSM agents. For example, the configuration for the NSM agent managing the central NAT CNF can be found in cnf-nat44.yaml.
More information about cloud-native tools and network functions provided by PANTHEON.tech can be found on our website here.
To confirm that client’s IP is indeed source NATed (from 192.168.100.10 to 80.80.80.102) before reaching the web server, one can use the VPP packet tracing:
PANTHEON.tech s.r.o., its products or services, are not affiliated with ServiceNow®, neither is this post an advertisement of ServiceNow® or its products.
ServiceNow® is a cloud-based platform, that enables enterprise organizations to automate business processes across the enterprise. We have previously shown, how to use ServiceNow® & OpenDaylight to automate your network.
We will demonstrate the possibility of using ServiceNow®, to interact with a firewall device. More precisely, we will manage Access Controls Lists (ACLs), which work on a set of rules that define how to forward or block packets in network traffic.
User Administration
The Now® platform offers, among other things, user administration, which allows us to work with users, assign them to groups, as well as assigning both to roles, based on their privileges. In this solution/demonstration, two different groups of users, with corresponding roles are used.
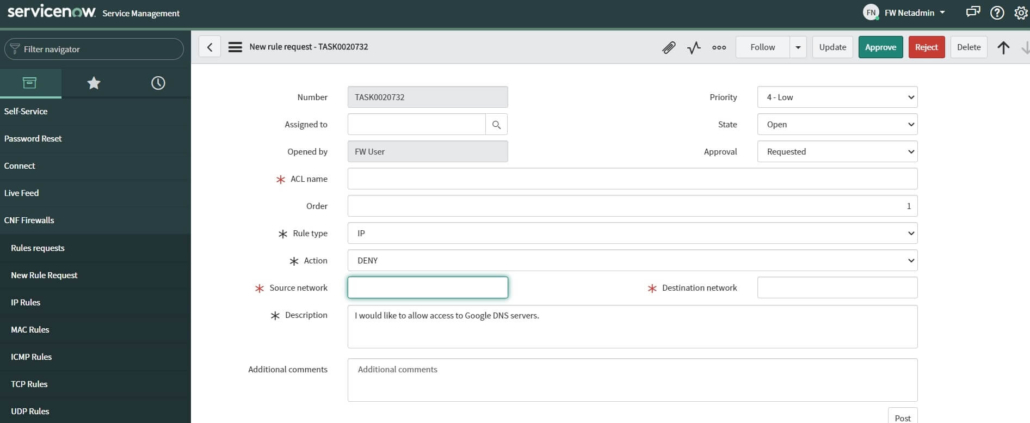
The first group of users are requestors, which may represent a basic end-user, employees, or customers of an enterprise organization. This user can create new rule requests by submitting a simple form. Without any knowledge of networking, the user can briefly describe his request in the description field.
This request will then be handled by the network admin. At the same time, users can monitor their requests and their status:
The custom table used in the request process is inherited from the Task table, which is one of the core tables provided with the base system. It provides a series of fields, which can be used in the process of request-items management and provide us access to approval logic.
Approval Strategy
Network admins form the second group of users. They receive requests from end-user and decide, if they will fulfill a request, or reject it.
If they decide to fulfill a request, they have an available, extended view of the previous form, which offers more specific fields and simply fills the necessary data. This data represents the ACL rule information, that will be later applied. There are several types of rules (IP, TCP, UDP, ICMP, MAC), and different properties (form fields) must be filled for each of these types.
NOTE: It is possible to add another group of users, which can for example fill details of the rule. This group will create another layer in the entire process, network admin then may focus only on requests approval or rejection.
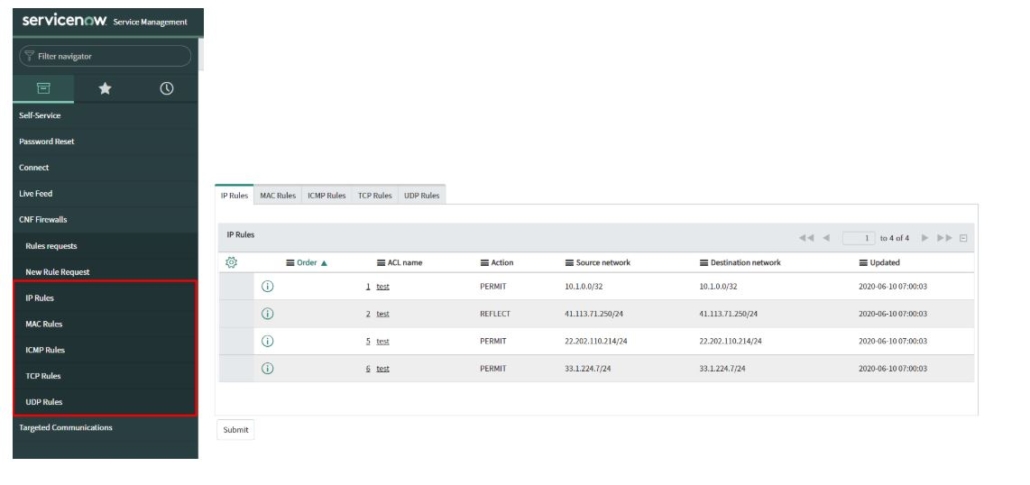
Network admin has an existing set of rules available, which are stored in tables, according to their type. Existing rules can be accessed from the Application navigator and viewed inside of the created rule request, which the admin is currently reviewing. Data in tables are updated on regular intervals, as well as after a new rule is added.
Workflow Overview
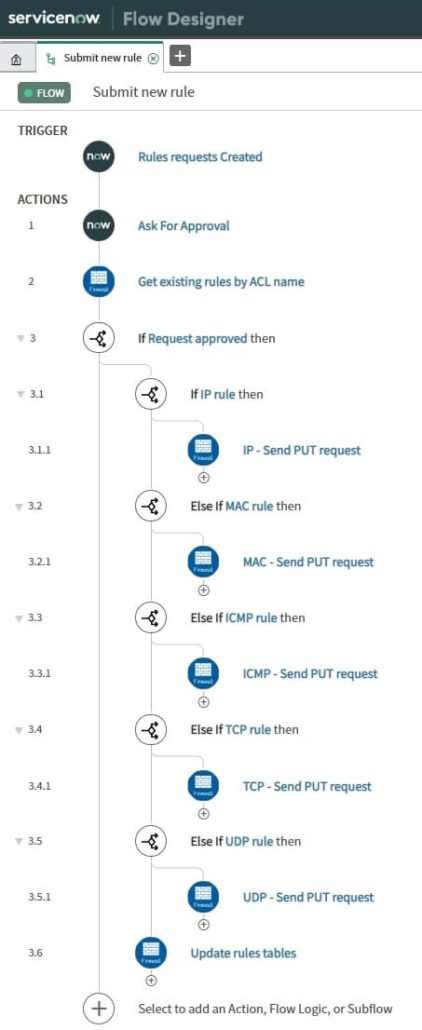
The network admin can decide to approve or reject the request. Once the request is approved, a flow of actions will be triggered. Everything after approval will be done automatically. A list of existing rules is GET from VPP-Agent, using the REST API call. Based on the type of ACL rule, the corresponding action is performed.
Each action consists of two steps. First, the payload is created by inserting new rules into a list of existing rules (if ACL already exists) or creating a new Access Control List (ACL). In the second step, a payload from the previous step is sent back to VPP-agent, using the REST API. At the end of this action flow, tables that contain data describing existing rules are updated.
Managing existing rules
In addition to the approval process, the network admin can also update existing rules, or create new rules. The network admin fills the data into a simple form. After submitting the form, a request is sent directly to the device, without the need of the approval process. Meanwhile, the rule is applied.
MID server
ServiceNow® applications need to communicate with external systems due to data transfer. For this purpose, the MID server is used, which runs as a Windows service or UNIX daemon. In our case, we need to get a list of existing rules from VPP-Agent or send a request to VPP-Agent, when we want to create or update rule. The advantage of a MID server is, that communications are initiated inside the enterprise’s firewall and therefore do not require any special firewall rules or VPNs.
This docker-compose file is based on this one from the official sdnc/oam Gerrit repository. The most important images are dgbuilder (which will start a webserver, where directed graphs can be created) and sdnc (the SDN-Controller itself).
To download and start images specified in the docker-compose file call this command:
docker-compose up
Be patient, it may take a while.
In the end, when everything is up & running, we should see a log stating that Karaf was started successfully. It should look similar to this:
sdnc_controller_container | Karaf started in 0s. Bundle stats: 12 active, 12 total
Directed Graph builder should be accessible through this address (port is specified in the docker-compose file):
https://localhost:3000
Default login for dgbuilder is:
username: dguser
password: test123
Upload and activate Directed Graphs
Steps how to upload DG from clipboard:
On the upper right side of the webpage click on the menu button
In the menu click on the “Import…” button
Select “Clipboard…” option
Paste json representation of the graph to the text field
Click “Ok”
Place graph on the sheet
Steps to activate DG:
Click on the small square at the left side of the beginning of the graph (DGSTART node)
Click on the “Upload XML” button
Click on the “ViewDGList” button
Click on the “Activate” button in the “Activate/Deactivate” column of the table
Click on the “Activate” button
In these files are exported, parametrized Directed Graphs to connect your Cisco NSO instance via NETCONF protocol. You can get information about connected the Cisco NSO instance from the operational datastore. To activate ACL service (that we created in this tutorial). We will use these in later steps, so you can upload and activate them in your SDN-C instance.
You can download the corresponding JSON files here:
In the previous tutorial, we started Cisco NSO with three simulated devices. Now, we are going to connect a running Cisco NSO instance to SDN-C, using the directed graphs we just imported and activated.
But first, we need to obtain the address of Cisco NSO which we will use in the connect request. Run docker inspect command from the terminal like this:
docker inspect sdnc_controller_container
Search for “NetworkSettings” – “Networks” – “yaml_default” – “Gateway”. The field “Gateway” contains an IP address that we will use, so save it for later. In my case it looks like this:
...
"Gateway": "172.18.0.1",
...
Now, we are going to connect to the SDN-C Karaf so we can see the log because some of the DGs write information in there. Execute these commands:
docker exec -it sdnc_controller_container /bin/bash
cd /opt/opendaylight/bin/
./client
log:tail
To execute the Directed Graph, call RESTCONF RPC SLI-API: execute-graph. To do this, call a POST request on URI:
Where <module-name> is the name of the module, where the RPC you want to call is located. <rpc-name> is the name of the RPC. Additionally, you can specify parameters if they are required. We are using port 8282, which we specified in the docker-compose file.
This Postman collection contains all the requests we are going to use now. Feel free to change any attributes, according to your needs.
Don’t forget to set the correct nodeAddress to this request – we got this value before by executing the docker inspect command.
The parameter nodeId specifies the name, under which we will address Cisco NSO in SDN-C. Other parameters are default for the Cisco NSO.
After executing this RPC, we should see our DG – ID of the Cisco NSO node and its connection status (which will be most probably “connecting”), in the SDN-C logs output.
...
12:57:14.654 INFO [qtp1682691455-1614] About to execute node #2 block node in graph SvcLogicGraph [module=NSO-operations, rpc=getNSO, mode=sync, version=1.0, md5sum=f7ed8e2805f0b823ab05ca9e7bb1b997]
12:57:14.656 INFO [qtp1682691455-1614] About to execute node #3 record node in graph SvcLogicGraph [module=NSO-operations, rpc=getNSO, mode=sync, version=1.0, md5sum=f7ed8e2805f0b823ab05ca9e7bb1b997]
12:57:14.671 INFO [qtp1682691455-1614] |Node ID is: nso|
12:57:14.672 INFO [qtp1682691455-1614] About to execute node #4 record node in graph SvcLogicGraph [module=NSO-operations, rpc=getNSO, mode=sync, version=1.0, md5sum=f7ed8e2805f0b823ab05ca9e7bb1b997]
12:57:14.674 INFO [qtp1682691455-1614] |Connection status is: connecting|
...
To check if Cisco NSO node was connected successfully, call getNSO DG. Execute SLI-API:execute-graph RPC with payload:
In the SDN-C logs, we should now see the “connected” status:
...
13:02:15.888 INFO [qtp1682691455-188] About to execute node #2 block node in graph SvcLogicGraph [module=NSO-operations, rpc=getNSO, mode=sync, version=1.0, md5sum=f7ed8e2805f0b823ab05ca9e7bb1b997]
13:02:15.889 INFO [qtp1682691455-188] About to execute node #3 record node in graph SvcLogicGraph [module=NSO-operations, rpc=getNSO, mode=sync, version=1.0, md5sum=f7ed8e2805f0b823ab05ca9e7bb1b997]
13:02:15.892 INFO [qtp1682691455-188] |Node ID is: nso|
13:02:15.893 INFO [qtp1682691455-188] About to execute node #4 record node in graph SvcLogicGraph [module=NSO-operations, rpc=getNSO, mode=sync, version=1.0, md5sum=f7ed8e2805f0b823ab05ca9e7bb1b997]
13:02:15.895 INFO [qtp1682691455-188] |Connection status is: connected|
...
Activate Cisco NSO service using Directed Graph
We are now going to activate the ACL service we created in this tutorial, by executing activateACL directed graph.
Execute SLI-API:execute-graph RPC with this payload:
Feel free to change the values of ACL parameters (but first check what types they are in the ACL service YANG model).
Unfortunately, at the time of writing this tutorial, there is a bug in the OpenDaylight NETCONF (NETCONF-568) with parsing output from this RPC call. It prevents the ODL from sending a response to the RESTCONF request we sent (SLI-API:execute-graph RPC) and we need to manually stop waiting for this response in the Postman (or another REST client you are using).
Now, the service should be activated! To check services activated in the Cisco NSO call GET request on URI:
To check if the device was configured log into Cisco NSO CLI and execute show command:
ncs_cli -u admin
show configuration devices device c1 config ios:interface
You should see an output, similar to this:
admin@ncs> show configuration devices device c1 config ios:interface
FastEthernet 1/0;
GigabitEthernet 1/1 {
ip {
access-group {
access-list aclFromDG;
direction in;
}
}
}
Congratulations
You have successfully connected SDN-C with the Cisco NSO and concluded our series! In case you would like a custom integration, feel free to contact us.
This feature allows us to easily generate a JSON with RESTCONF API documentation of OpenDaylight RESTCONF applications and import it into various services, such as ServiceNow®. This feature is not only about the generation of JSON with OpenAPI. It also includes Swagger UI based on generated JSON.
OpenAPI, formerly known as Swagger UI, visualizes API resources and enables the user to interact with them. This kind of visualization provides an easier way to implement APIs in the back-end while automating the creation of documentation for the APIs in question.
OpenAPI Specification on the other hand (OAS for short), is a language-agnostic interface description for RESTful APIs. Its purpose is to visualize them and make the APIs readable for people and PCs alike, in YAML or JSON formats.
OAS 3.0 introduced several major changes, which made the specification structure clearer and more efficient. For a rundown of changes from OpenAPI 2 to version 3, make sure to visit this page detailing them.
How does it work?
OpenAPI is generated on the fly, with every manual request for the OpenAPI specification of the selected resource. The resource can be the OpenDaylight datastore or a device mount point.
You can conveniently access the list of all available resources over the apidoc web application. The resources are located on the top right part of the screen. Once you select the resource you want to generate the OpenAPI specification for, you just pick the desired resource and the OpenAPI specification will be displayed below.
The apidoc is packed within the odl-restconf-all Karaf feature. To access it, you only need to type
feature:install odl-restconf-all
in the Karaf console. Then, you can use a web browser of your choice to access the apidoc web application over the following URL:
http://localhost:8181/apidoc/explorer/index.html
Once an option is selected, the page will load the documentation of your chosen resource, with the chosen protocol version.
The documentation of any resource endpoint (node, RPC’s, actions), is located under its module spoiler. When you click on the link:
you will get the OpenAPI JSON for the particular RESTCONF version and selected resource. Here is a code snippet from the resulting OpenAPI specification:
{
"openapi": "3.0.3",
"info": {
"version": "1.0.0",
"title": "simulator-device21 modules of RestConf version RFC8040"
},
"servers": [
{
"url": "http://localhost:8181/"
}
],
"paths": {
"/rests/data/network-topology:network-topology/topology=topology-netconf/node=simulator-device21/yang-ext:mount": {
"get": {
"description": "Queries the operational (running) datastore on the mounted hosted.",
"summary": "GET - simulator-device21 - data",
"tags": [
"mounted simulator-device21 GET root"
],
"responses": {
"200": {
"description": "OK"
}
}
}
},
"/rests/operations/network-topology:network-topology/topology=topology-netconf/node=simulator-device21/yang-ext:mount": {
"get": {
"description": "Queries the available operations (RPC calls) on the mounted hosted.",
"summary": "GET - simulator-device21 - operations",
"tags": [
"mounted simulator-device21 GET root"
],
"responses": {
"200": {
"description": "OK"
}
}
}
}
...
You can look through the entire export by clicking here.
Our Commitment to Open-Source
PANTHEON.tech is one of the largest contributors to the OpenDaylight source-code, with extensive knowledge that goes beyond a general service or integration.
This just goes to show, that PANTHEON.tech is heavily involved in the development and progress of OpenDaylight. We are glad to be part of the open-source community and contributors.
PANTHEON.tech s.r.o., its products or services, are not affiliated with ServiceNow®, neither is this post an advertisement of ServiceNow® or its products.
ServiceNow® is a complex cloud application, used to manage companies, their employees, and customers. It was designed to help you automate the IT aspects of your business – service, operations, and business management. It creates incidents where using flows, you can automate part of the work that is very often done manually. All this can be easily set up by any person, even if you are not a developer.
An Example
If a new employee is hired in the company, he will need access to several things, based on his position. An incident will be created in ServiceNow® by HR. This will trigger a pre-created, generic flow, which might, for example, notify his direct supervisor (probably manager) and he would be asked to approve this request of access.
Once approved, the flow may continue and set everything up for this employee. It may notify the network engineer, to provision the required network services like (VPN, static IPs, firewall rules, and more), in order to give a new employee a computer. Once done, he will just update the status of this task to done, which may trigger another action. It can automatically give him access to the company intranet. Once everything is done, it will notify everyone it needs to, about a successful job done, with an email or any other communication resource the company is using.
Setting Up the Flow
Let’s take it a step further, and try to replace the network engineer, who has to manually configure the services needed for the device.
In a simple environment with a few network devices, we could set up the ServiceNow® Workflow, so that it can access them directly and edit the configuration, according to the required parameters.
In a complex, multi-tenant environment we could leverage a network controller, that can serve the required service and maintain the configuration of several devices. This will make the required service functional. In that case, we will need ServiceNow® to communicate with the controller, which secures this required network service.
The ServiceNow® orchestration understands and reads REST, OpenDaylight & lighty.io – in our case, the controller. It provides us with the RESTCONF interface, with which we can easily integrate ServiceNow®, OpenDaylight, or lighty.io, thanks to the support of both these technologies.
Now, we look at how to simplify this integration. For this purpose, we used OpenAPI.
This is one of the features, thanks to which we can generate a JSON according to the OpenAPI specification for every OpenDaylight/lighty.io application with RESTCONF, which we can then import into ServiceNow®.
If your question is, whether it is possible to integrate a network controller, for example, OpenDaylight or lighty.io, the answer is yes. Yes, it is.
Example of Network Automation
Let’s say we have an application with a UI, that will let us manage the network with a control station. We want to connect a new device to it and set up its interfaces. Manually, you would have to make sure that the device is running. If not, we have to contact IT support to plug it in, create a request to connect to it. Once done, we have to create another request to set up the interfaces and verify the setup.
Using flows in ServiceNow® will let you do all that automatically. All your application needs to do, is create an incident in ServiceNow ®. This incident would be set up as a trigger, for a flow to start. It would try to create a connection using a REST request, that would be chosen from API operations, which we have from our OpenAPI JSON. This was automatically generated from YANG files, that are used in the project.
If a connection fails, then it would automatically send an email to IT support, creating a new, separate incident, that would have to be marked as done before this flow can continue. Once done, we can try to connect again using the same REST. When the connection is successful, we can choose a new API operation again, that would process the interfaces.
After that, we can choose another API operation that would get all the created settings and send that to the person, that created this incident using an email and mark this incident as done.
OpenAPI & oneOf
Since the “New York” release of ServiceNow®, the import of OpenAPI is a new feature, it has some limitations.
During usage, we noticed a few inconsistencies, which we would like to share with you. Here are some tips, what you should look out for when using this feature.
OpenAPI & ServiceNow®
OpenAPI supports the oneOf feature, which is something that is needed for choice keywords in YANG. You can choose, which nodes you want to use. Currently, the workaround for this is to use the Swagger 2.0 implementation, which does not support the oneOf feature and will list all the cases that exist in a choice statement. If you go to input variables, you may delete any input variables that you don’t want yourself.
JSONs & identical item names
Another issue is when we have a JSON that contains the same item names in different objects or levels. So if I need the following JSON:
The workaround is, to add other input variables manually, that will have the same name, like the one that is missing. Suddenly, it may appear twice in input variables, but during testing, it appears only once – where it’s supposed to. Therefore, you need to manually fill in all the missing variables using the “+” button in the input variables tab.we have the username and password twice. However, it would appear in the input variables just once. When testing the action, I was unable to fill it in like the above JSON.
Input Variables in ServiceNow®
The last issue that we have, is with ServiceNow® not requiring input variables. Imagine you create an action with REST Step. If there are some variables that you don’t need to set up, you would normally not assign any value to that variable and it would not be set.
Here, it would automatically set it to a default value or an empty string if there is no default value, which can cause some problems with decimals as well – since you should not put strings into a decimal variable.
Again, the workaround is to remove all the input variables, that you are not going to use.
Updated 11/05/2020:Our Unified Firewall Demo was updated with additional insight, as to how we achieved great results with our solution.
We differentiate generally between a hardware and software firewall. Software firewalls can reside in the userspace (for example, VPP) or the kernel space (for example, NetFilter). These serve as a basis for cloud-native firewalls. The main advantage of software firewalls is the ability to scale without hardware. This is done in the virtual machines or containers (Docker), where these firewalls reside and function from.
One traditional firewall utility in Linux is named iptables. It is configured via command-line and acts as an enforcer of rules and configuration of Netfilter. You can find a great how-to in the Ubuntu Documentation on configuring iptables, which is found pre-installed in most Linux distributions.
If we have sparked your interest in this solution, make sure to contact us directly. Until then, make sure to watch our CNF project closely – there is more to come!
Firewall Solutions
Multiple solutions mean a wide variety of a user or company is able to choose from. But since each firewall uses a different API, we can almost immediately see an issue with the management of multiple solutions. Some APIs are more fully-fledged than others while requiring various levels of access (high level vs. low-level API) and several layers of features.
At PANTHEON.tech, we found that having a unified API, above which a management system would reside, would make a perfectly balanced firewall.
Cloud-Native: We will be using the open-source Ligato, micro-services platform. The advantage is, Ligato being cloud-native.
Implementation: The current implementation unifies the ACL in FD.io‘s VPP and the NetFilter in the Linux Kernel. For this purpose, we will be using the open-source VPP-Agent from Ligato.
Separate Layers: This architecture enables us to extend it to any configurable firewall, as seen below.
Layer Responsibilities: Computer networks are divided into network layers, where each layer has a different responsibility. We have modeled (proto-model) a unification API and translation to technology-specific firewall configuration. The unified layer has a unified API, which it translates and sends to the technology-specific API. The current implementation is via the VPP-Agent Docker container.
Ligato and VPP-Agent: In this implementation, we make full-use of VPP-Agent and Ligato, via gRPC communication. Each firewall has an API, modeled like a proto-model. This makes resolving failures a breeze.
Resolving Failures: Imagine that, in a cloud, software can end with a fatal error. The common solution is to suspend the container and restart it. This means, however, that you need to set up the configuration again or synchronize it with an existing configuration from higher layers.
Fast Reading of Configurations: There is no need to load everything again throughout all layers, up until the concrete firewall technology. These can be often slow in loading the configuration. Ligato resolves this via the configurations residing in the Ligato platform, in an external key-value storage (ETCD, if integrated with Ligato).
How did we do this?
We created this unifying API by using a healthy subset of all technologies. We preferred simplified API writing – since, for example in iptables, there can be lots of rules which can be written in a more compact way.
We analyzed several firewall APIs, which we broke down into basic blocks. We defined the basic filters for packet traffic, meaning the way from which interface, which way the traffic is flowing. Furthermore, we defined rules, based on the selector being the final filter for rules and actions, which should occur for selected traffic (simple allow/deny operation).
There are several types of selectors:
L2 (according to the sources MAC address)
L3 (IP and ICMP Selector)
L4 (Only TCP traffic via flags and ports / UDP traffic via ports)
The read/write performance of our Unified Firewall Layer solution, was tested using VPP and iptables (netfilter), at 250k rules. The initial tests ended with poor writing speed. But we experimented with various combinations and ended up putting a lot of rules into a few rule-groups.
That did not go as planned either.
A deep analysis showed that the issue is not within Ligato, since task-manager showed that the VPP/Linux kernel was fully working. We made an additional verification for iptables, only by using go-iptables library. It was very slow when adding too many rules in one chain. Fortunately, iptables provides us with additional tools, which are able to export and import data fast. The disadvantage is, that the export format is poorly documented. However, I did an iptables export and insert of data closely before the commit, and imported the data back afterward.
# Generated by iptables-save v1.6.1
*filter
:INPUT ACCEPT [0:0]
:FORWARD DROP [0:0]
:OUTPUT ACCEPT [0:0]
:DOCKER - [0:0]
:DOCKER-ISOLATION-STAGE-1 - [0:0]
:DOCKER-ISOLATION-STAGE-2 - [0:0]
:DOCKER-USER - [0:0]
:testchain - [0:0]
-A FORWARD -j DOCKER-USER
-A FORWARD -j DOCKER-ISOLATION-STAGE-1
-A FORWARD -o docker0 -m conntrack --ctstate RELATED,ESTABLISHED -j ACCEPT
-A FORWARD -o docker0 -j DOCKER
-A FORWARD -i docker0 ! -o docker0 -j ACCEPT
-A FORWARD -i docker0 -o docker0 -j ACCEPT
-A DOCKER-ISOLATION-STAGE-1 -i docker0 ! -o docker0 -j DOCKER-ISOLATION-STAGE-2
-A DOCKER-ISOLATION-STAGE-1 -j RETURN
-A DOCKER-ISOLATION-STAGE-2 -o docker0 -j DROP
-A DOCKER-ISOLATION-STAGE-2 -j RETURN
-A DOCKER-USER -j RETURN
<<insert new data here>>
COMMIT
Our Open-Source Commitment
We achieved a speed increase for 20k rules in 1 iptable chain – from 3 minutes and 14 seconds to a few seconds. This showed a perfect performance fix for the VPP-Agent, which we committed to the Ligato VPP-Agent repository.
This also benefited updates, since each updated has to be implemented as a delete and create case (recreated each time). I made it as an optional method with a custom number of rules, from which it applies. Using too few rules can result in great speed with the default approach (via API iptables rule). Now, we have a solution for using a lot of rules as well. Due to the lack of detailed documentation of the iptables-save output format, I decided on turning this option off by default.
The results of the performance test are:
25 rule-groups x 10000rules for each rule-group
Write: 1 minute 49 seconds
Read: 359.045785ms
Reading is super-fast, due to all data being in the RAM in the Unified Layer. This means, that it’s all about one gRPC call with encoding/decoding.
If we have sparked your interest in this solution, make sure to contact us directly.
PANTHEON.tech’s developer Július Milan has managed to integrate memif into the T-REX Traffic Generator. T-REX is a traffic generator, which you can use to test the speed of network devices. Now you can test Cloud-Native Functions, which support memif natively in the cloud, without specialized network cards!
Imagine a situation, where multiple cloud-native functions are interconnected or chained via memif. Tracking their utilization would be a nightmare. With our memif + T-REX solution, you can make arbitrary measurements – effortlessly and straightforward. The results will be more precise and direct, as opposed to creating adapters and interconnecting them, in order to be able to measure traffic.
Our commitment to open-source has a long track record. With lighty-core being open-sourced and our CTO Robert Varga being the top-single contributor to OpenDaylight source code, we are proving once again that our heart belongs to the open-source community.
The combination of memif & T-REX makes measuring cloud-native function performance easy & straightforward.
memif, the “shared memory packet interface”, allows for any client (VPP, libmemif) to communicate with DPDK using shared memory. Our solution makes memif highly efficient, with zero-copy capability. This saves memory bandwidth and CPU cycles while adding another piece to the puzzle for achieving a high-performance CNF.
It is important to note, that zero-copy works on the newest version of DPDK. However, memif & T-REX can be used in zero-copy mode, when the T-REX side of the pair is the master. The other side of the memif pair (VPP or some cloud-native function) is the zero-copy slave.
T-REX, developed by Cisco, solves the issue of buying stateful/realistic traffic generators, which can set your company back by up to 500 000$. This limits the testing capabilities and slows down the entire process. T-REX solves this by being an accessible, open-source, stateful/stateless traffic generator, fueled by DPDK.
Services that function in the cloud are characterized by an unlimited presence. They are accessed from anywhere, with a functional connection and are located on remote servers. This may curb costs since you do not have to create and maintain your servers in a dedicated, physical space.
PANTHEON.tech is proud to be a technology enabler, with continuous support for open-source initiatives, communities & solutions.
To provide the best experiences, we use technologies like cookies to store and/or access device information. Consenting to these technologies will allow us to process data such as browsing behavior or unique IDs on this site. Not consenting or withdrawing consent, may adversely affect certain features and functions.
Functional
Always active
The technical storage or access is strictly necessary for the legitimate purpose of enabling the use of a specific service explicitly requested by the subscriber or user, or for the sole purpose of carrying out the transmission of a communication over an electronic communications network.
Preferences
The technical storage or access is necessary for the legitimate purpose of storing preferences that are not requested by the subscriber or user.
Statistics
The technical storage or access that is used exclusively for statistical purposes.The technical storage or access that is used exclusively for anonymous statistical purposes. Without a subpoena, voluntary compliance on the part of your Internet Service Provider, or additional records from a third party, information stored or retrieved for this purpose alone cannot usually be used to identify you.
Marketing
The technical storage or access is required to create user profiles to send advertising, or to track the user on a website or across several websites for similar marketing purposes.