PANTHEON.tech
  • About Us
    • Expertise
    • Services
    • References & Partners
    • Tools
  • Products
    • Orchestration
    • Automation
    • Network Functions
    • Security
  • Blog & News
  • Career
  • Contact
  • Click to open the search input field Click to open the search input field Search
  • Menu Menu
  • Link to LinkedIn
  • Link to Youtube
  • Link to X
  • Link to Instagram
openapi opendaylight

OpenAPI 3.0 & OpenDaylight: A PANTHEON.tech Initiative

June 12, 2020/in Blog, OpenDaylight /by PANTHEON.tech

PANTHEON.tech has created a commit in the official OpenDaylight repository, which updates the version of Swagger generator to OpenAPI 3.0.

This feature allows us to easily generate a JSON with RESTCONF API documentation of OpenDaylight RESTCONF applications and import it into various services, such as ServiceNow®. This feature is not only about the generation of JSON with OpenAPI. It also includes Swagger UI based on generated JSON.

What is RESTCONF API?

RESTCONF API is an interface, which allows access to datastores in the controller, via HTTP requests. OpenDaylight supports two versions of RESTCONF protocol:

  • draft-bierman-netconf-restconf-02
  • RFC8040.

What is OpenAPI?

OpenAPI, formerly known as Swagger UI, visualizes API resources and enables the user to interact with them. This kind of visualization provides an easier way to implement APIs in the back-end while automating the creation of documentation for the APIs in question.

OpenAPI Specification on the other hand (OAS for short), is a language-agnostic interface description for RESTful APIs. Its purpose is to visualize them and make the APIs readable for people and PCs alike, in YAML or JSON formats.

OAS 3.0 introduced several major changes, which made the specification structure clearer and more efficient. For a rundown of changes from OpenAPI 2 to version 3, make sure to visit this page detailing them.

How does it work?

OpenAPI is generated on the fly, with every manual request for the OpenAPI specification of the selected resource. The resource can be the OpenDaylight datastore or a device mount point. 

You can conveniently access the list of all available resources over the apidoc web application. The resources are located on the top right part of the screen. Once you select the resource you want to generate the OpenAPI specification for, you just pick the desired resource and the OpenAPI specification will be displayed below.

OpenAPI 3.0 (Swagger) in OpenDaylight

The apidoc is packed within the odl-restconf-all Karaf feature. To access it, you only need to type

feature:install odl-restconf-all

in the Karaf console. Then, you can use a web browser of your choice to access the apidoc web application over the following URL:

http://localhost:8181/apidoc/explorer/index.html

Once an option is selected, the page will load the documentation of your chosen resource, with the chosen protocol version.

The documentation of any resource endpoint (node, RPC’s, actions), is located under its module spoiler. When you click on the link:

http://localhost:8181/apidoc/openapi3/${RESTCONF_version}/apis/${RESOURCE}

you will get the OpenAPI JSON for the particular RESTCONF version and selected resource. Here is a code snippet from the resulting OpenAPI specification:

{
  "openapi": "3.0.3",
  "info": {
    "version": "1.0.0",
    "title": "simulator-device21 modules of RestConf version RFC8040"
  },
  "servers": [
    {
      "url": "http://localhost:8181/"
    }
  ],
  "paths": {
    "/rests/data/network-topology:network-topology/topology=topology-netconf/node=simulator-device21/yang-ext:mount": {
      "get": {
        "description": "Queries the operational (running) datastore on the mounted hosted.",
        "summary": "GET - simulator-device21 - data",
        "tags": [
          "mounted simulator-device21 GET root"
        ],
        "responses": {
          "200": {
            "description": "OK"
          }
        }
      }
    },
    "/rests/operations/network-topology:network-topology/topology=topology-netconf/node=simulator-device21/yang-ext:mount": {
      "get": {
        "description": "Queries the available operations (RPC calls) on the mounted hosted.",
        "summary": "GET - simulator-device21 - operations",
        "tags": [
          "mounted simulator-device21 GET root"
        ],
        "responses": {
          "200": {
            "description": "OK"
          }
        }
      }
    }
...

You can look through the entire export by clicking here.

Our Commitment to Open-Source

PANTHEON.tech is one of the largest contributors to the OpenDaylight source-code, with extensive knowledge that goes beyond a general service or integration.

This just goes to show, that PANTHEON.tech is heavily involved in the development and progress of OpenDaylight. We are glad to be part of the open-source community and contributors.


You can contact us at https://pantheon.tech/

Explore our PANTHEOn.tech GitHub.

Watch our YouTube Channel.

network automation

[Hands-On] Network Automation with ServiceNow® & OpenDaylight

May 13, 2020/in Blog, OpenDaylight /by PANTHEON.tech

by Miroslav Kováč | Leave us your feedback on this post!

PANTHEON.tech s.r.o., its products or services, are not affiliated with ServiceNow®, neither is this post an advertisement of ServiceNow® or its products.

ServiceNow® is a complex cloud application, used to manage companies, their employees, and customers. It was designed to help you automate the IT aspects of your business – service, operations, and business management. It creates incidents where using flows, you can automate part of the work that is very often done manually. All this can be easily set up by any person, even if you are not a developer.

An Example

If a new employee is hired in the company, he will need access to several things, based on his position. An incident will be created in ServiceNow® by HR. This will trigger a pre-created, generic flow, which might, for example, notify his direct supervisor (probably manager) and he would be asked to approve this request of access.

Once approved, the flow may continue and set everything up for this employee. It may notify the network engineer, to provision the required network services like (VPN, static IPs, firewall rules, and more), in order to give a new employee a computer. Once done, he will just update the status of this task to done, which may trigger another action. It can automatically give him access to the company intranet. Once everything is done, it will notify everyone it needs to, about a successful job done, with an email or any other communication resource the company is using.

Showing the ServiceNow® Flow Designer


Setting Up the Flow

Let’s take it a step further, and try to replace the network engineer, who has to manually configure the services needed for the device.

In a simple environment with a few network devices, we could set up the ServiceNow® Workflow, so that it can access them directly and edit the configuration, according to the required parameters.

In a complex, multi-tenant environment we could leverage a network controller, that can serve the required service and maintain the configuration of several devices. This will make the required service functional. In that case, we will need ServiceNow® to communicate with the controller, which secures this required network service.

The ServiceNow® orchestration understands and reads REST, OpenDaylight & lighty.io – in our case, the controller. It provides us with the RESTCONF interface, with which we can easily integrate ServiceNow®, OpenDaylight, or lighty.io, thanks to the support of both these technologies.

Now, we look at how to simplify this integration. For this purpose, we used OpenAPI.

This is one of the features, thanks to which we can generate a JSON according to the OpenAPI specification for every OpenDaylight/lighty.io application with RESTCONF, which we can then import into ServiceNow®.

If your question is, whether it is possible to integrate a network controller, for example, OpenDaylight or lighty.io, the answer is yes. Yes, it is.

Example of Network Automation

Let’s say we have an application with a UI, that will let us manage the network with a control station. We want to connect a new device to it and set up its interfaces. Manually, you would have to make sure that the device is running. If not, we have to contact IT support to plug it in, create a request to connect to it. Once done, we have to create another request to set up the interfaces and verify the setup.

Using flows in ServiceNow® will let you do all that automatically. All your application needs to do, is create an incident in ServiceNow ®. This incident would be set up as a trigger, for a flow to start. It would try to create a connection using a REST request, that would be chosen from API operations, which we have from our OpenAPI JSON. This was automatically generated from YANG files, that are used in the project.

If a connection fails, then it would automatically send an email to IT support, creating a new, separate incident, that would have to be marked as done before this flow can continue. Once done, we can try to connect again using the same REST. When the connection is successful, we can choose a new API operation again, that would process the interfaces.

After that, we can choose another API operation that would get all the created settings and send that to the person, that created this incident using an email and mark this incident as done.

OpenAPI & oneOf

Showing the ServiceNow® API Operation

Since the “New York” release of ServiceNow®, the import of OpenAPI is a new feature, it has some limitations.

During usage, we noticed a few inconsistencies, which we would like to share with you. Here are some tips, what you should look out for when using this feature.

OpenAPI & ServiceNow®

OpenAPI supports the oneOf feature, which is something that is needed for choice keywords in YANG. You can choose, which nodes you want to use. Currently, the workaround for this is to use the Swagger 2.0 implementation, which does not support the oneOf feature and will list all the cases that exist in a choice statement. If you go to input variables, you may delete any input variables that you don’t want yourself.

JSONs & identical item names

Another issue is when we have a JSON that contains the same item names in different objects or levels. So if I need the following JSON:

{
    "username": "foo",
    "password": "bar":,
    "another-log-in": {
        "username": "foo",
        "password": "bar"
    }
}

The workaround is, to add other input variables manually, that will have the same name, like the one that is missing. Suddenly, it may appear twice in input variables, but during testing, it appears only once – where it’s supposed to. Therefore, you need to manually fill in all the missing variables using the “+” button in the input variables tab.we have the username and password twice. However, it would appear in the input variables just once. When testing the action, I was unable to fill it in like the above JSON.

showing the ServiceNow® inputs

Input Variables in ServiceNow®

The last issue that we have, is with ServiceNow® not requiring input variables. Imagine you create an action with REST Step. If there are some variables that you don’t need to set up, you would normally not assign any value to that variable and it would not be set.

Here, it would automatically set it to a default value or an empty string if there is no default value, which can cause some problems with decimals as well – since you should not put strings into a decimal variable.

Again, the workaround is to remove all the input variables, that you are not going to use.

This concludes our network automation with the ServiceNow guide. Leave us your feedback on this post!


You can contact us at https://pantheon.tech/

Explore our Pantheon GitHub.

Watch our YouTube Channel.

firewall blog

A Cloud-Native & Unified Firewall

April 28, 2020/in Blog, CDNF.io /by PANTHEON.tech

by Filip Gschwandtner | Leave us your feedback on this post!

Updated 11/05/2020: Our Unified Firewall Demo was updated with additional insight, as to how we achieved great results with our solution.

We differentiate generally between a hardware and software firewall. Software firewalls can reside in the userspace (for example, VPP) or the kernel space (for example, NetFilter). These serve as a basis for cloud-native firewalls. The main advantage of software firewalls is the ability to scale without hardware. This is done in the virtual machines or containers (Docker), where these firewalls reside and function from.

One traditional firewall utility in Linux is named iptables. It is configured via command-line and acts as an enforcer of rules and configuration of Netfilter. You can find a great how-to in the Ubuntu Documentation on configuring iptables, which is found pre-installed in most Linux distributions.

For a more performance-oriented firewall solution, you can turn to the evergreen, Vector Packet Processing framework and Access Control Lists (ACLs).

Our CNF Project offers such a cloud-native function – Access Control List (ACL)-based firewall between CNF interfaces with FD.io VPP dataplane and Ligato management plane.

If we have sparked your interest in this solution, make sure to contact us directly. Until then, make sure to watch our CNF project closely – there is more to come!

Firewall Solutions

Multiple solutions mean a wide variety of a user or company is able to choose from. But since each firewall uses a different API, we can almost immediately see an issue with the management of multiple solutions. Some APIs are more fully-fledged than others while requiring various levels of access (high level vs. low-level API) and several layers of features.

At PANTHEON.tech, we found that having a unified API, above which a management system would reside, would make a perfectly balanced firewall.

Cloud-Native: We will be using the open-source Ligato, micro-services platform. The advantage is, Ligato being cloud-native.

Implementation: The current implementation unifies the ACL in FD.io‘s VPP and the NetFilter in the Linux Kernel. For this purpose, we will be using the open-source VPP-Agent from Ligato.

Separate Layers: This architecture enables us to extend it to any configurable firewall, as seen below.

image2020 4 28 14 5 19

Layer Responsibilities: Computer networks are divided into network layers, where each layer has a different responsibility. We have modeled (proto-model) a unification API and translation to technology-specific firewall configuration. The unified layer has a unified API, which it translates and sends to the technology-specific API. The current implementation is via the VPP-Agent Docker container.

Ligato and VPP-Agent: In this implementation, we make full-use of VPP-Agent and Ligato, via gRPC communication. Each firewall has an API, modeled like a proto-model. This makes resolving failures a breeze.

Resolving Failures: Imagine that, in a cloud, software can end with a fatal error. The common solution is to suspend the container and restart it. This means, however, that you need to set up the configuration again or synchronize it with an existing configuration from higher layers.

Fast Reading of Configurations: There is no need to load everything again throughout all layers, up until the concrete firewall technology. These can be often slow in loading the configuration. Ligato resolves this via the configurations residing in the Ligato platform, in an external key-value storage (ETCD, if integrated with Ligato).

How did we do this?

We created this unifying API by using a healthy subset of all technologies. We preferred simplified API writing – since, for example in iptables, there can be lots of rules which can be written in a more compact way.

We analyzed several firewall APIs, which we broke down into basic blocks. We defined the basic filters for packet traffic, meaning the way from which interface, which way the traffic is flowing. Furthermore, we defined rules, based on the selector being the final filter for rules and actions, which should occur for selected traffic (simple allow/deny operation).

There are several types of selectors:

  • L2 (according to the sources MAC address)
  • L3 (IP and ICMP Selector)
  • L4 (Only TCP traffic via flags and ports / UDP traffic via ports)

The read/write performance of our Unified Firewall Layer solution, was tested using VPP and iptables (netfilter), at 250k rules. The initial tests ended with poor writing speed. But we experimented with various combinations and ended up putting a lot of rules into a few rule-groups.

That did not go as planned either.

A deep analysis showed that the issue is not within Ligato, since task-manager showed that the VPP/Linux kernel was fully working. We made an additional verification for iptables, only by using go-iptables library. It was very slow when adding too many rules in one chain. Fortunately, iptables provides us with additional tools, which are able to export and import data fast. The disadvantage is, that the export format is poorly documented. However, I did an iptables export and insert of data closely before the commit, and imported the data back afterward.

# Generated by iptables-save v1.6.1
*filter
:INPUT ACCEPT [0:0]
:FORWARD DROP [0:0]
:OUTPUT ACCEPT [0:0]
:DOCKER - [0:0]
:DOCKER-ISOLATION-STAGE-1 - [0:0]
:DOCKER-ISOLATION-STAGE-2 - [0:0]
:DOCKER-USER - [0:0]
:testchain - [0:0]
-A FORWARD -j DOCKER-USER
-A FORWARD -j DOCKER-ISOLATION-STAGE-1
-A FORWARD -o docker0 -m conntrack --ctstate RELATED,ESTABLISHED -j ACCEPT
-A FORWARD -o docker0 -j DOCKER
-A FORWARD -i docker0 ! -o docker0 -j ACCEPT
-A FORWARD -i docker0 -o docker0 -j ACCEPT
-A DOCKER-ISOLATION-STAGE-1 -i docker0 ! -o docker0 -j DOCKER-ISOLATION-STAGE-2
-A DOCKER-ISOLATION-STAGE-1 -j RETURN
-A DOCKER-ISOLATION-STAGE-2 -o docker0 -j DROP
-A DOCKER-ISOLATION-STAGE-2 -j RETURN
-A DOCKER-USER -j RETURN
<<insert new data here>>
COMMIT

Our Open-Source Commitment

We achieved a speed increase for 20k rules in 1 iptable chain – from 3 minutes and 14 seconds to a few seconds. This showed a perfect performance fix for the VPP-Agent, which we committed to the Ligato VPP-Agent repository.

This also benefited updates, since each updated has to be implemented as a delete and create case (recreated each time). I made it as an optional method with a custom number of rules, from which it applies. Using too few rules can result in great speed with the default approach (via API iptables rule). Now, we have a solution for using a lot of rules as well. Due to the lack of detailed documentation of the iptables-save output format, I decided on turning this option off by default.

The results of the performance test are:

  • 25 rule-groups x 10000 rules for each rule-group
  • Write: 1 minute 49 seconds
  • Read: 359.045785ms

Reading is super-fast, due to all data being in the RAM in the Unified Layer. This means, that it’s all about one gRPC call with encoding/decoding.

If we have sparked your interest in this solution, make sure to contact us directly.

trex memif

memif + T-REX: CNF Testing Made Easy

February 18, 2020/in CDNF.io, News /by PANTHEON.tech

PANTHEON.tech’s developer Július Milan has managed to integrate memif into the T-REX Traffic Generator. T-REX is a traffic generator, which you can use to test the speed of network devices. Now you can test Cloud-Native Functions, which support memif natively in the cloud, without specialized network cards!

Imagine a situation, where multiple cloud-native functions are interconnected or chained via memif. Tracking their utilization would be a nightmare. With our memif + T-REX solution, you can make arbitrary measurements – effortlessly and straightforward. The results will be more precise and direct, as opposed to creating adapters and interconnecting them, in order to be able to measure traffic.

Our commitment to open-source has a long track record. With lighty-core being open-sourced and our CTO Robert Varga being the top-single contributor to OpenDaylight source code, we are proving once again that our heart belongs to the open-source community.

The combination of memif & T-REX makes measuring cloud-native function performance easy & straightforward.

memif, the “shared memory packet interface”, allows for any client (VPP, libmemif) to communicate with DPDK using shared memory. Our solution makes memif highly efficient, with zero-copy capability. This saves memory bandwidth and CPU cycles while adding another piece to the puzzle for achieving a high-performance CNF.

It is important to note, that zero-copy works on the newest version of DPDK. However, memif & T-REX can be used in zero-copy mode, when the T-REX side of the pair is the master. The other side of the memif pair (VPP or some cloud-native function) is the zero-copy slave.

T-REX, developed by Cisco, solves the issue of buying stateful/realistic traffic generators, which can set your company back by up to 500 000$. This limits the testing capabilities and slows down the entire process. T-REX solves this by being an accessible, open-source, stateful/stateless traffic generator, fueled by DPDK.

Services that function in the cloud are characterized by an unlimited presence. They are accessed from anywhere, with a functional connection and are located on remote servers. This may curb costs since you do not have to create and maintain your servers in a dedicated, physical space.

PANTHEON.tech is proud to be a technology enabler, with continuous support for open-source initiatives, communities & solutions.


You can contact us at https://pantheon.tech/

Explore our Pantheon GitHub.

Watch our YouTube Channel.

VPP 105: Memory Management & DPDK APIs

VPP 105: Memory Management & DPDK APIs

January 9, 2020/in Blog, VPP /by PANTHEON.tech

Welcome to the 5th part of our VPP Guide series! Today, we will be asking ourselves practical questions regarding the various technologies & libraries managed in VPP – their usage, advantages, and management. Let’s jump right into it and ask ourselves:

Why does DPDK use Hugepages?

Hugepages

Hugepages is one of the techniques used in virtual memory management. In a standard environment, CPU allocates memory (virtual) for each process. Those blocks of memory are called „pages“ and for efficiency in Linux kernel the size of allocated memory is 4kB. When a process wants to access its memory, CPU has to find where this virtual memory is – this is the task of Memory Management Unit and page table lookup. Using the page table structure CPU could map virtual to physical memory.

CONTACT US FOR A CUSTOM INTEGRATION

For example, when the process needs 1GB of memory, this leads to more than 200k of pages in the page table which the CPU has to lookup for. Of course, this leads to performance slowdown. Fortunately, nowadays CPUs support bigger pages – so-called Hugepages. They can reduce the number of pages to be lookup for and usage of huge pages increases performance.

Memory Management Unit uses one additional hardware cache – Translation Lookaside Buffers (TLB). When there is address translation from virtual memory to physical memory, translation is calculated in MMU, and this mapping is stored in the TLB. So next time accessing the same page will be first handled by TLB (which is fast) and then by MMU.

As TLB is a hardware cache, it has a limited number of entries, so a large number of pages will slow down the application. So a combination of TLB with Hugepages reduces the time it takes to translate a virtual page address to a physical page address and to lookup for and so again it will increase performance.

This is the reason why DPDK, and VPP as well, uses Hugepages for large memory pool allocation, used for packet buffers. By using Hugepages allocations, performance is increased since fewer pages and fewer lookups are needed and the management is more effective.

Cache prefetching

Cache prefetching is another technique used by VPP to boost execution performance. Prefetching data from their original storage in slower memory to a faster local memory before it is actually needed significantly increase performance. CPUs have fast and local cache memory in which prefetched data is held until it is required. Examples of CPU caches with a specific function are the D-cache (data cache), I-cache (instruction cache) and the TLB (translation lookaside buffer) for the MMU. Separated D-cache and I-cache makes it possible to fetch instructions and data in parallel. Moreover, instructions and data have different access patterns.

Cache prefetching is used mainly in nodes when processing packets. In VPP, each node has a registered function responsible for incoming traffic handling. An example of registration (abf and flowprobe nodes):

/*
 * Copyright (c) 2017 Cisco and/or its affiliates. Licensed under the Apache License, Version 2.0. You may obtain a copy of the License at: http://www.apache.org/licenses/LICENSE-2.0
 */

VLIB_REGISTER_NODE (abf_ip4_node) = {
  .function = abf_input_ip4,
  .name = "abf-input-ip4",

VLIB_REGISTER_NODE (flowprobe_ip4_node) = {
  .function = flowprobe_ip4_node_fn,
  .name = "flowprobe-ip4",

In abf processing function, we can see single loop handling – it loops over packets and handles them one by one.

/*
 * Copyright (c) 2017 Cisco and/or its affiliates. Licensed under the Apache License, Version 2.0. You may obtain a copy of the License at: http://www.apache.org/licenses/LICENSE-2.0
 */

abf_input_inline (vlib_main_t * vm,
      vlib_node_runtime_t * node,
      vlib_frame_t * frame, fib_protocol_t fproto)
{
...
      while (n_left_from > 0 && n_left_to_next > 0)
  {
...	
    abf_next_t next0 = ABF_NEXT_DROP;
    vlib_buffer_t *b0;
    u32 bi0, sw_if_index0;
...
    bi0 = from[0];
    to_next[0] = bi0;
    from += 1;
    to_next += 1;
    n_left_from -= 1;
    n_left_to_next -= 1;

    b0 = vlib_get_buffer (vm, bi0);
    sw_if_index0 = vnet_buffer (b0)->sw_if_index[VLIB_RX];

    ASSERT (vec_len (abf_per_itf[fproto]) > sw_if_index0);
    attachments0 = abf_per_itf[fproto][sw_if_index0];
...
    /* verify speculative enqueue, maybe switch current next frame */
    vlib_validate_buffer_enqueue_x1 (vm, node, next_index,
             to_next, n_left_to_next, bi0,
             next0);
  }
      vlib_put_next_frame (vm, node, next_index, n_left_to_next);
    }

In flowprobe node, we can see quad/single loop using prefetching which can significantly increase performance. In the first loop:

/*
 * Copyright (c) 2015 Cisco and/or its affiliates. Licensed under the Apache License, Version 2.0. You may obtain a copy of the License at: http://www.apache.org/licenses/LICENSE-2.0
 */

( while (n_left_from >= 4 ... ) )

it processes buffers b0 and b1 (and moreover, the next two buffers are prefetched), and in the next loop

/*
 * Copyright (c) 2015 Cisco and/or its affiliates. Licensed under the Apache License, Version 2.0. You may obtain a copy of the License at: http://www.apache.org/licenses/LICENSE-2.0
 */

( while (n_left_from > 0 ... ) )

remaining packets are processed.

/*
 * Copyright (c) 2018 Cisco and/or its affiliates. Licensed under the Apache License, Version 2.0. You may obtain a copy of the License at: http://www.apache.org/licenses/LICENSE-2.0
 */

flowprobe_node_fn (vlib_main_t * vm,
       vlib_node_runtime_t * node, vlib_frame_t * frame,
       flowprobe_variant_t which)
{
...
      /*
      * While we have at least 4 vector elements (pkts) to process..
      */

      while (n_left_from >= 4 && n_left_to_next >= 2)
  {
...
    /* Prefetch next iteration. */
    {
      vlib_buffer_t *p2, *p3;

      p2 = vlib_get_buffer (vm, from[2]);
      p3 = vlib_get_buffer (vm, from[3]);

      vlib_prefetch_buffer_header (p2, LOAD);
      vlib_prefetch_buffer_header (p3, LOAD);

      CLIB_PREFETCH (p2->data, CLIB_CACHE_LINE_BYTES, STORE);
      CLIB_PREFETCH (p3->data, CLIB_CACHE_LINE_BYTES, STORE);
    }
...
    /* speculatively enqueue b0 and b1 to the current next frame */
    b0 = vlib_get_buffer (vm, bi0);
    b1 = vlib_get_buffer (vm, bi1);


    /* verify speculative enqueues, maybe switch current next frame */
    vlib_validate_buffer_enqueue_x2 (vm, node, next_index,
             to_next, n_left_to_next,
             bi0, bi1, next0, next1);
  }
      /*
      * Clean up 0...3 remaining packets at the end of the frame
      */
      while (n_left_from > 0 && n_left_to_next > 0)
  {
    u32 bi0;
    vlib_buffer_t *b0;
    u32 next0 = FLOWPROBE_NEXT_DROP;
    u16 len0;

    /* speculatively enqueue b0 to the current next frame */
    bi0 = from[0];
    to_next[0] = bi0;
    from += 1;
    to_next += 1;
    n_left_from -= 1;
    n_left_to_next -= 1;

    b0 = vlib_get_buffer (vm, bi0);

    vnet_feature_next (&next0, b0);

    len0 = vlib_buffer_length_in_chain (vm, b0);
    ethernet_header_t *eh0 = vlib_buffer_get_current (b0);
    u16 ethertype0 = clib_net_to_host_u16 (eh0->type);

    if (PREDICT_TRUE ((b0->flags & VNET_BUFFER_F_FLOW_REPORT) == 0))
      {
        flowprobe_trace_t *t = 0;
        if (PREDICT_FALSE ((node->flags & VLIB_NODE_FLAG_TRACE)
         && (b0->flags & VLIB_BUFFER_IS_TRACED)))
    t = vlib_add_trace (vm, node, b0, sizeof (*t));

        add_to_flow_record_state (vm, node, fm, b0, timestamp, len0,
          flowprobe_get_variant
          (which, fm->context[which].flags,
           ethertype0), t);
      }

    /* verify speculative enqueue, maybe switch current next frame */
    vlib_validate_buffer_enqueue_x1 (vm, node, next_index,
             to_next, n_left_to_next,
             bi0, next0);
  }

VPP I/O Request Handling

Why is polling faster than IRQs? How do the hardware/software IRQs work?

I/O device (NIC) event handling is a significant part of VPP. The CPU doesn’t know when an I/O event can occur, but it has to respond. There are two different approaches – IRQ and Polling, which are different from each other in many aspects.

From a CPU point of view, IRQ seems to be better, as the device disturbs the CPU only when it needs servicing, instead of constantly checking device status in case of polling. But from an efficiency point of view, interruptions are inefficient when the devices keep on interrupting the CPU repeatedly and polling is inefficient when the CPU device is rarely ready for servicing.

As in the case of packet processing in VPP, it is expected that traffic will be permanent. In such a case, the number of interruptions would rapidly increase. On the other hand, the device will be ready for service all the time. So polling seems to be more efficient for packet processing and it is the reason why VPP uses polling when processing the incoming packet.

VPP & DPDK

What API does DPDK offer? How does VPP use this library?

DPDK networking drivers are classified in two categories:

  • physical for real devices
  • virtual for emulated devices

The DPDK ethdev layer exposes APIs, in order to use the networking functions of these devices. For a full list of the supported features and APIs, click here.

In VPP, DPDK support has been moved from core to plugin to simplify enabling/disabling and handling DPDK interfaces. To simplify and store all DPDK relevant info, a DPDK device implementation (src/plugin/dpdk/device/dpdk.h) has a structure with DPDK data:

/* SPDX-License-Identifier: BSD-3-Clause
 * Copyright(c) 2010-2014 Intel Corporation
 */

typedef struct
{
...
  struct rte_eth_conf port_conf;
  struct rte_eth_txconf tx_conf;
...
  struct rte_flow_error last_flow_error;
...
  struct rte_eth_link link;
...
  struct rte_eth_stats stats;
  struct rte_eth_stats last_stats;
  struct rte_eth_xstat *xstats;
...
} dpdk_device_t;

containing all relevant DPDK structs used in VPP, to store DPDK relevant info.

DPDK APIs are used in the DPDK plugin only. Here is a list of DPDK features and their API’s used in VPP, with a few examples of usage.

Speed Capabilities / Runtime Rx / Tx Queue Setup

Supports getting the speed capabilities that the current device is capable of. Supports Rx queue setup after the device started.

API: rte_eth_dev_info_get()

/*
 * Copyright (c) 2017 Cisco and/or its affiliates. Licensed under the Apache License, Version 2.0. You may obtain a copy of the License at: http://www.apache.org/licenses/LICENSE-2.0
 */

dpdk_device_setup (dpdk_device_t * xd)
{
  dpdk_main_t *dm = &dpdk_main;
...
  struct rte_eth_dev_info dev_info;
...
  if (xd->flags & DPDK_DEVICE_FLAG_ADMIN_UP)
    {
      vnet_hw_interface_set_flags (dm->vnet_main, xd->hw_if_index, 0);
      dpdk_device_stop (xd);
    }

  /* Enable flow director when flows exist */
  if (xd->pmd == VNET_DPDK_PMD_I40E)
    {
      if ((xd->flags & DPDK_DEVICE_FLAG_RX_FLOW_OFFLOAD) != 0)
  xd->port_conf.fdir_conf.mode = RTE_FDIR_MODE_PERFECT;
      else
  xd->port_conf.fdir_conf.mode = RTE_FDIR_MODE_NONE;
    }

  rte_eth_dev_info_get (xd->port_id, &dev_info);

Link Status

Supports getting the link speed, duplex mode and link-state (up/down).

API: rte_eth_link_get_nowait()

/*
 *Copyright (c) 2015 Cisco and/or its affiliates. Licensed under the Apache License, Version 2.0. You may obtain a copy of the License at: http://www.apache.org/licenses/LICENSE-2.0
 */

dpdk_update_link_state (dpdk_device_t * xd, f64 now)
{
  vnet_main_t *vnm = vnet_get_main ();
  struct rte_eth_link prev_link = xd->link;
...
  /* only update link state for PMD interfaces */
  if ((xd->flags & DPDK_DEVICE_FLAG_PMD) == 0)
    return;

  xd->time_last_link_update = now ? now : xd->time_last_link_update;
  clib_memset (&xd->link, 0, sizeof (xd->link));
  rte_eth_link_get_nowait (xd->port_id, &xd->link);

Lock-Free Tx Queue

If a PMD advertises DEV_TX_OFFLOAD_MT_LOCKFREE capable, multiple threads can invoke rte_eth_tx_burst() concurrently on the same Tx queue without SW lock.

API: rte_eth_tx_burst()

/*
 * Copyright (c) 2015 Cisco and/or its affiliates. Licensed under the Apache License, Version 2.0. You may obtain a copy of the License at: http://www.apache.org/licenses/LICENSE-2.0
 */

static clib_error_t *
dpdk_lib_init (dpdk_main_t * dm)
{
...
  dpdk_device_t *xd;
...
      if (xd->pmd == VNET_DPDK_PMD_FAILSAFE)
  {
    /* failsafe device numerables are reported with active device only,
     * need to query the mtu for current device setup to overwrite
     * reported value.
     */
    uint16_t dev_mtu;
    if (!rte_eth_dev_get_mtu (i, &dev_mtu))
      {
        mtu = dev_mtu;
        max_rx_frame = mtu + sizeof (ethernet_header_t);

        if (dpdk_port_crc_strip_enabled (xd))
    {
      max_rx_frame += 4;
    }
      }
  }

Promiscuous Mode

Supports enabling/disabling promiscuous mode for a port.

API: rte_eth_promiscuous_enable(), rte_eth_promiscuous_disable(), rte_eth_promiscuous_get()

Allmulticast Mode

Supports enabling/disabling receiving multicast frames.

API: rte_eth_allmulticast_enable(), rte_eth_allmulticast_disable(), rte_eth_allmulticast_get()

/*
 * Copyright (c) 2017 Cisco and/or its affiliates. Licensed under the Apache License, Version 2.0. You may obtain a copy of the License at: http://www.apache.org/licenses/LICENSE-2.0
 */

dpdk_device_stop (dpdk_device_t * xd)
{
  if (xd->flags & DPDK_DEVICE_FLAG_PMD_INIT_FAIL)
    return;

  rte_eth_allmulticast_disable (xd->port_id);
  rte_eth_dev_stop (xd->port_id);
...

Unicast MAC Filter

Supports adding MAC addresses to enable white-list filtering to accept packets.

API: rte_eth_dev_default_mac_addr_set(), rte_eth_dev_mac_addr_add(), rte_eth_dev_mac_addr_remove(), rte_eth_macaddr_get()

VLAN Filter

Supports filtering of a VLAN Tag identifier.

API: rte_eth_dev_vlan_filter()

VLAN Offload

Supports VLAN offload to hardware.

API: rte_eth_dev_set_vlan_offload(), rte_eth_dev_get_vlan_offload()

/*
 * Copyright (c) 2015 Cisco and/or its affiliates. Licensed under the Apache License, Version 2.0. You may obtain a copy of the License at: http://www.apache.org/licenses/LICENSE-2.0
 */

dpdk_subif_add_del_function (vnet_main_t * vnm,
           u32 hw_if_index,
           struct vnet_sw_interface_t *st, int is_add)
{
...
  dpdk_device_t *xd = vec_elt_at_index (xm->devices, hw->dev_instance);
  int r, vlan_offload;
...
  vlan_offload = rte_eth_dev_get_vlan_offload (xd->port_id);
  vlan_offload |= ETH_VLAN_FILTER_OFFLOAD;

  if ((r = rte_eth_dev_set_vlan_offload (xd->port_id, vlan_offload)))
    {
      xd->num_subifs = prev_subifs;
      err = clib_error_return (0, "rte_eth_dev_set_vlan_offload[%d]: err %d",
             xd->port_id, r);
      goto done;
    }

  if ((r =
       rte_eth_dev_vlan_filter (xd->port_id,
        t->sub.eth.outer_vlan_id, is_add)))
    {
      xd->num_subifs = prev_subifs;
      err = clib_error_return (0, "rte_eth_dev_vlan_filter[%d]: err %d",
             xd->port_id, r);
      goto done;
    }

Basic Stats

Support basic statistics such as: ipackets, opackets, ibytes, obytes, imissed, ierrors, oerrors, rx_nombuf. And per queue stats: q_ipackets, q_opackets, q_ibytes, q_obytes, q_errors.

API: rte_eth_stats_get, rte_eth_stats_reset()

/*
 * Copyright (c) 2015 Cisco and/or its affiliates. Licensed under the Apache License, Version 2.0. You may obtain a copy of the License at: http://www.apache.org/licenses/LICENSE-2.0
 */

dpdk_update_counters (dpdk_device_t * xd, f64 now)
{
  vlib_simple_counter_main_t *cm;
  vnet_main_t *vnm = vnet_get_main ();
  u32 thread_index = vlib_get_thread_index ();
  u64 rxerrors, last_rxerrors;

  /* only update counters for PMD interfaces */
  if ((xd->flags & DPDK_DEVICE_FLAG_PMD) == 0)
    return;

  xd->time_last_stats_update = now ? now : xd->time_last_stats_update;
  clib_memcpy_fast (&xd->last_stats, &xd->stats, sizeof (xd->last_stats));
  rte_eth_stats_get (xd->port_id, &xd->stats);

Extended Stats

Supports Extended Statistics, changes from driver to driver.

API: rte_eth_xstats_get(), rte_eth_xstats_reset(), rte_eth_xstats_get_names, rte_eth_xstats_get_by_id(), rte_eth_xstats_get_names_by_id(), rte_eth_xstats_get_id_by_name()

Module EEPROM Dump

Supports getting information and data of plugin module eeprom.

API: rte_eth_dev_get_module_info(), rte_eth_dev_get_module_eeprom()


VPP Library (vlib)

What funcionality does vlib offer?

Vlib is a vector processing library. It also handles various application management functions:

  • buffer, memory, and graph node management and scheduling
  • reliable multicast support
  • ultra-lightweight cooperative multi-tasking threads
  • physical memory, and Linux epoll support
  • maintaining and exporting counters
  • thread management
  • packet tracing.

Vlib also implements the debug CLI.

In VPP (vlib), a vector is an instance of the vlib_frame_t type:

/*
 * Copyright (c) 2015 Cisco and/or its affiliates. Licensed under the Apache License, Version 2.0. You may obtain a copy of the License at: http://www.apache.org/licenses/LICENSE-2.0
 */

typedef struct vlib_frame_t
{
  /* Frame flags. */
  u16 flags;

  /* Number of scalar bytes in arguments. */
  u8 scalar_size;

  /* Number of bytes per vector argument. */
  u8 vector_size;

  /* Number of vector elements currently in frame. */
  u16 n_vectors;

  /* Scalar and vector arguments to next node. */
  u8 arguments[0];
} vlib_frame_t;

As shown, vectors are dynamically resized arrays with user-defined “headers”. Many data structures in VPP (buffers, hash, heap, pool) are vectors with different headers.

The memory layout looks like this:

© Copyright 2018, Linux Foundation


User header (optional, uword aligned)
                  Alignment padding (if needed)
                  Vector length in elements
User's pointer -> Vector element 0
                  Vector element 1
                  ...
                  Vector element N-1

Vectors are not only used in vppinfra data structures (hash, heap, pool, …) but also in vlib – in nodes, buffers, processes and more.

Buffers

Vlib buffers are used to reach high performance in packet processing. To do so, one allocates/frees N-buffers at once, rather than one at a time – except for directly processing specific buffer (its packets in given node), one deals with buffer indices instead of buffer pointers. Vlib buffers have a structure of a vector:

/*
 * Copyright (c) 2015 Cisco and/or its affiliates. Licensed under the Apache License, Version 2.0. You may obtain a copy of the License at: http://www.apache.org/licenses/LICENSE-2.0
 */

/** VLIB buffer representation. */
typedef union
{
  struct
  {
    CLIB_CACHE_LINE_ALIGN_MARK (cacheline0);

    /** signed offset in data[], pre_data[] that we are currently
      * processing. If negative current header points into predata area.  */
    i16 current_data;

    /** Nbytes between current data and the end of this buffer.  */
    u16 current_length;
...
    /** Opaque data used by sub-graphs for their own purposes. */
    u32 opaque[10];
...
    /**< More opaque data, see ../vnet/vnet/buffer.h */
    u32 opaque2[14];

    /** start of third cache line */
      CLIB_CACHE_LINE_ALIGN_MARK (cacheline2);

    /** Space for inserting data before buffer start.  Packet rewrite string
      * will be rewritten backwards and may extend back before
      * buffer->data[0].  Must come directly before packet data.  */
    u8 pre_data[VLIB_BUFFER_PRE_DATA_SIZE];

    /** Packet data */
    u8 data[0];
  };
#ifdef CLIB_HAVE_VEC128
  u8x16 as_u8x16[4];
#endif
#ifdef CLIB_HAVE_VEC256
  u8x32 as_u8x32[2];
#endif
#ifdef CLIB_HAVE_VEC512
  u8x64 as_u8x64[1];
#endif
} vlib_buffer_t;

Each vlib_buffer_t (packet buffer) carries the buffer metadata, which describes the current packet-processing state.

  • u8 data[0]: Ordinarily, hardware devices use data as the DMA target but there are exceptions. Do not access data directly, use vlib_buffer_get_current.
  • u32 opaque[10]: primary vnet-layer opaque data
  • u32 opaque2[14]: secondary vnet-layer opaque data

There are several functions to get data from vector (vlib/node_funcs.h):

To get a pointer to frame vector data

/*
 * Copyright (c) 2015 Cisco and/or its affiliates. Licensed under the Apache License, Version 2.0. You may obtain a copy of the License at: http://www.apache.org/licenses/LICENSE-2.0
 */

always_inline void *
vlib_frame_vector_args (vlib_frame_t * f)
{
  return (void *) f + vlib_frame_vector_byte_offset (f->scalar_size);
}
-	to get pointer to scalar data
always_inline void *
vlib_frame_scalar_args (vlib_frame_t * f)
{
  return vlib_frame_vector_args (f) - f->scalar_size;
}

Get pointer to scalar data

/*
 * Copyright (c) 2015 Cisco and/or its affiliates. Licensed under the Apache License, Version 2.0. You may obtain a copy of the License at: http://www.apache.org/licenses/LICENSE-2.0
 */

always_inline void *
vlib_frame_scalar_args (vlib_frame_t * f)
{
  return vlib_frame_vector_args (f) - f->scalar_size;
}

Translate the buffer index into buffer pointer

/*
 * Copyright (c) 2015 Cisco and/or its affiliates. Licensed under the Apache License, Version 2.0. You may obtain a copy of the License at: http://www.apache.org/licenses/LICENSE-2.0
 */

always_inline vlib_buffer_t *
vlib_get_buffer (vlib_main_t * vm, u32 buffer_index)
{
  vlib_buffer_main_t *bm = vm->buffer_main;
  vlib_buffer_t *b;

  b = vlib_buffer_ptr_from_index (bm->buffer_mem_start, buffer_index, 0);
  vlib_buffer_validate (vm, b);
  return b;
}

Get the pointer to current (packet) data from a buffer to process

/*
 * Copyright (c) 2015 Cisco and/or its affiliates. Licensed under the Apache License, Version 2.0. You may obtain a copy of the License at: http://www.apache.org/licenses/LICENSE-2.0
 */

always_inline void *
vlib_buffer_get_current (vlib_buffer_t * b)
{
  /* Check bounds. */
  ASSERT ((signed) b->current_data >= (signed) -VLIB_BUFFER_PRE_DATA_SIZE);
  return b->data + b->current_data;

Get vnet primary buffer metadata in the reserved opaque field

/*
 * Copyright (c) 2015 Cisco and/or its affiliates. Licensed under the Apache License, Version 2.0. You may obtain a copy of the License at: http://www.apache.org/licenses/LICENSE-2.0<br >
 */

#define vnet_buffer(b) ((vnet_buffer_opaque_t *) (b)->opaque)

An example to retrieve vnet buffer data:

/*
 * Copyright (c) 2017 Cisco and/or its affiliates. Licensed under the Apache License, Version 2.0. You may obtain a copy of the License at: http://www.apache.org/licenses/LICENSE-2.0
 */

add_to_flow_record_state (vlib_main_t * vm, vlib_node_runtime_t * node,
        flowprobe_main_t * fm, vlib_buffer_t * b,
        timestamp_nsec_t timestamp, u16 length,
        flowprobe_variant_t which, flowprobe_trace_t * t)
{
...
  u32 rx_sw_if_index = vnet_buffer (b)->sw_if_index[VLIB_RX];

Get vnet primary buffer metadata in reserved opaque2 field

/*
 * Copyright (c) 2017 Cisco and/or its affiliates. Licensed under the Apache License, Version 2.0. You may obtain a copy of the License at: http://www.apache.org/licenses/LICENSE-2.0
 */

#define vnet_buffer2(b) ((vnet_buffer_opaque2_t *) (b)->opaque2)

Let’s take a look at flowprobe node processing function. Vlib functions always start with a vlib_ prefix.

/*
 * Copyright (c) 2017 Cisco and/or its affiliates. Licensed under the Apache License, Version 2.0. You may obtain a copy of the License at: http://www.apache.org/licenses/LICENSE-2.0
 */

flowprobe_node_fn (vlib_main_t * vm,
       vlib_node_runtime_t * node, vlib_frame_t * frame,
       flowprobe_variant_t which)
{
  u32 n_left_from, *from, *to_next;
  flowprobe_next_t next_index;
  flowprobe_main_t *fm = &flowprobe_main;
  timestamp_nsec_t timestamp;

  unix_time_now_nsec_fraction (&timestamp.sec, &timestamp.nsec);
  
// access frame vector data
  from = vlib_frame_vector_args (frame);
  n_left_from = frame->n_vectors;
  next_index = node->cached_next_index;

  while (n_left_from > 0)
    {
      u32 n_left_to_next;

      // get pointer to next vector data
      vlib_get_next_frame (vm, node, next_index, to_next, n_left_to_next);

// dual loop – we are processing two buffers and prefetching next two buffers
      while (n_left_from >= 4 && n_left_to_next >= 2)
  {
    u32 next0 = FLOWPROBE_NEXT_DROP;
    u32 next1 = FLOWPROBE_NEXT_DROP;
    u16 len0, len1;
    u32 bi0, bi1;
    vlib_buffer_t *b0, *b1;

    /* Prefetch next iteration. */
             // prefetching packets p3 and p4 while p1 and p2 are processed
    {
      vlib_buffer_t *p2, *p3;

      p2 = vlib_get_buffer (vm, from[2]);
      p3 = vlib_get_buffer (vm, from[3]);

      vlib_prefetch_buffer_header (p2, LOAD);
      vlib_prefetch_buffer_header (p3, LOAD);

      CLIB_PREFETCH (p2->data, CLIB_CACHE_LINE_BYTES, STORE);
      CLIB_PREFETCH (p3->data, CLIB_CACHE_LINE_BYTES, STORE);
    }
/* speculatively enqueue b0 and b1 to the current next frame */
// frame contains buffer indecies (bi0, bi1) instead of pointers
    to_next[0] = bi0 = from[0];
    to_next[1] = bi1 = from[1];
    from += 2;
    to_next += 2;
    n_left_from -= 2;
    n_left_to_next -= 2;

// translate buffer index to buffer pointer
    b0 = vlib_get_buffer (vm, bi0);
    b1 = vlib_get_buffer (vm, bi1);
// select next node based on feature arc
    vnet_feature_next (&next0, b0);
    vnet_feature_next (&next1, b1);

    len0 = vlib_buffer_length_in_chain (vm, b0);
// get current data (header) from packet to process
// currently we are on L2 so get etehernet header, but if we
// are on L3 for example we can retrieve L3 header, i.e.
// ip4_header_t *ip0 = (ip4_header_t *) ((u8 *) vlib_buffer_get_current (b0) 
    ethernet_header_t *eh0 = vlib_buffer_get_current (b0);
    u16 ethertype0 = clib_net_to_host_u16 (eh0->type);

    if (PREDICT_TRUE ((b0->flags & VNET_BUFFER_F_FLOW_REPORT) == 0))
      add_to_flow_record_state (vm, node, fm, b0, timestamp, len0,
              flowprobe_get_variant
              (which, fm->context[which].flags,
               ethertype0), 0);
...
/* verify speculative enqueue, maybe switch current next frame */
    vlib_validate_buffer_enqueue_x1 (vm, node, next_index,
             to_next, n_left_to_next,
             bi0, next0);
  }

      vlib_put_next_frame (vm, node, next_index, n_left_to_next);
    }
  return frame->n_vectors;
}

Nodes

As we said – vlib is also designed for graph node management. When creating a new feature, one has to initialize it, using the VLIB_INIT_FUNCTION macro. This constructs a vlib_node_registration_t, most often via the VLIB_REGISTER_NODE macro. At runtime, the framework processes the set of such registrations into a directed graph.

/*
 * Copyright (c) 2016 Cisco and/or its affiliates. Licensed under the Apache License, Version 2.0. You may obtain a copy of the License at: http://www.apache.org/licenses/LICENSE-2.0<br >
 */

static clib_error_t *
flowprobe_init (vlib_main_t * vm)
{
  /* ... initialize things ... */
 
  return 0;
}

VLIB_INIT_FUNCTION (flowprobe_init);

...

VLIB_REGISTER_NODE (flowprobe_l2_node) = {
  .function = flowprobe_l2_node_fn,
  .name = "flowprobe-l2",
  .vector_size = sizeof (u32),
  .format_trace = format_flowprobe_trace,
  .type = VLIB_NODE_TYPE_INTERNAL,
  .n_errors = ARRAY_LEN(flowprobe_error_strings),
  .error_strings = flowprobe_error_strings,
  .n_next_nodes = FLOWPROBE_N_NEXT,
  .next_nodes = FLOWPROBE_NEXT_NODES,
};

VLIB_REGISTER_NODE (flowprobe_walker_node) = {
  .function = flowprobe_walker_process,
  .name = "flowprobe-walker",
  .type = VLIB_NODE_TYPE_INPUT,
  .state = VLIB_NODE_STATE_INTERRUPT,
};

Type member in node registration specifies the purpose of the node:

  • VLIB_NODE_TYPE_PRE_INPUT – run before all other node types
  • VLIB_NODE_TYPE_INPUT – run as often as possible, after pre_input nodes
  • VLIB_NODE_TYPE_INTERNAL – only when explicitly made runnable by adding pending frames for processing
  • VLIB_NODE_TYPE_PROCESS – only when explicitly made runnable.

The initialization of feature is executed at some point in the application’s startup. However, constraints must be used to specify an order (when one feature has to be initialized after/before another one). To hook feature into specific feature arc VNET_FEATURE_INT macro can be used.

/*
 * Copyright (c) 2016 Cisco and/or its affiliates. Licensed under the Apache License, Version 2.0. You may obtain a copy of the License at: http://www.apache.org/licenses/LICENSE-2.0
 */

VNET_FEATURE_INIT (ip4_nat44_ed_hairpin_src, static) = {
  .arc_name = "ip4-output",
  .node_name = "nat44-ed-hairpin-src",
  .runs_after = VNET_FEATURES ("acl-plugin-out-ip4-fa"),
};

VNET_FEATURE_INIT (ip4_nat_hairpinning, static) =
{
  .arc_name = "ip4-local",
  .node_name = "nat44-hairpinning",
  .runs_before = VNET_FEATURES("ip4-local-end-of-arc"),
};

Since VLIB_NODE_TYPE_INPUT nodes are the starting point of a feature arc, they are responsible for generating packets from some source, like a NIC or PCAP file and injecting them into the rest of the graph.

When registering a node, one can provide a .next_node parameter with an indexed list of the upcoming nodes in the graph. For example, a flowprobe node below:

/*
 * Copyright (c) 2017 Cisco and/or its affiliates. Licensed under the Apache License, Version 2.0. You may obtain a copy of the License at: http://www.apache.org/licenses/LICENSE-2.0<br >
 */

...
next_nodes = FLOWPROBE_NEXT_NODES,
...

#define FLOWPROBE_NEXT_NODES {				\
    [FLOWPROBE_NEXT_DROP] = "error-drop",		\
    [FLOWPROBE_NEXT_IP4_LOOKUP] = "ip4-lookup",		\
}

vnet_feature_next is commonly used to select the next node. This selection is based on the feature mechanism, as in the flowprobe example above:

/*
 * Copyright (c) 2017 Cisco and/or its affiliates. Licensed under the Apache License, Version 2.0. You may obtain a copy of the License at: http://www.apache.org/licenses/LICENSE-2.0
 */

flowprobe_node_fn (vlib_main_t * vm,
       vlib_node_runtime_t * node, vlib_frame_t * frame,
       flowprobe_variant_t which)
{
...
    b0 = vlib_get_buffer (vm, bi0);
    b1 = vlib_get_buffer (vm, bi1);
        // select next node based on feature arc
    vnet_feature_next (&next0, b0);
    vnet_feature_next (&next1, b1);

The graph node dispatcher pushes the work-vector through the directed graph, subdividing it as needed until the original work-vector has been completely processed.

Graph node dispatch functions call vlib_get_next_frame to set (u32 *)to_next to the right place in the vlib_frame_t, corresponding to the ith arc (known as next0) from the current node, to the indicated next node.

Before a dispatch function returns, it’s required to call vlib_put_next_frame for all of the graph arcs it actually used. This action adds a vlib_pending_frame_t to the graph dispatcher’s pending frame vector.

/*
 * Copyright (c) 2015 Cisco and/or its affiliates. Licensed under the Apache License, Version 2.0. You may obtain a copy of the License at: http://www.apache.org/licenses/LICENSE-2.0
 */

      vlib_put_next_frame (vm, node, next_index, n_left_to_next);
    }
  return frame->n_vectors;
}

Pavel Kotúček

Thank you for reading through the 5th part of our PANTHEON.tech VPP Guide! As always, feel free to contact us if you are interested in customized solutions!


You can contact us at https://pantheon.tech/

Explore our Pantheon GitHub.

Watch our YouTube Channel.

tehlova

[Guide] Intro to Vector Packet Processing (VPP)

January 3, 2020/in Blog /by PANTHEON.tech

Welcome to our new series on how to build and program FD.io‘s Vector Packet Processing framework, also known as VPP.

CONTACT US FOR A CUSTOM INTEGRATION

The name stems from VPP’s usage of vector processing, which can process multiple packets at a time with low latency. Single packet processing and high latency were a common occurrence in the older, scalar processing approach, which VPP aims to make obsolete.

What will this series include?

This four-part series will include the following features, with the ultimate goal on getting to know your VPP framework and adapting it to your network:

  1. Binary API
  2. Honeycomb/hc2vpp
  3. Ligato VPP Agent
  4. gRPC/REST
  5. Memory Management & DPDK APIs

Why should I start using Vector Package Processing?

The main advantages are:

  • high performance with a proven technology
  • production level quality
  • flexible and extensible

The principle of VPP is, that you can plugin a new graph node, adapt it to your networks purposes and run it right off the bat. Including a new plugin does not mean, you need to change your core-code with each new addition. Plugins can be either included in the processing graph, or they can be built outside the source tree and become an individual component in your build.

Furthermore, this separation of plugins makes crashes a matter of a simple process restart, which does not require your whole build to be restarted because of one plugin failure.

For a full list of features, please visit the official Vector Package Processing Wiki.You can also check our previous installments on VPP integration.

Preparation of VPP packages

In order to build and start with VPP yourself, you will have to:

  1. Download VPP’s repository from this page or follow the installation instructions
  2. Clone the repository inside your system, or from VPP’s GitHub

Enjoy and explore the repository as you wish. We will continue exploring the Binary API in the next part of our series.


You can contact us at https://pantheon.tech/

Explore our Pantheon GitHub.

Watch our YouTube Channel.

Java Article featured

The Future of Java

June 28, 2019/in Blog /by PANTHEON.tech

by Filip Čúzy | Leave us your feedback on this post!

Oracle has made headlines and created community uproar when it announced that the Java SE platform will be undergoing major changes.

The platform has had an interesting history of release cycles. At first, releases were lead by major features. No new feature meant no release – so new features determined release dates. It took, for example, three years to reach Java SE 8 from its previous version.

The Future of Java - Hello World

Since Java 9, time-driven releases with the following patterns emerged: Long Term Support releases for a 3-year cycle & new features every 6 months. When talking about Java development, three main terms need to be taken into account:

  • Java Development Kit (JDK), for development of applications
  • Java Runtime Environment (JRE), to run applications
  • Java Standard Edition, development kit & run-time environment

Most importantly, the product was licensed under the Binary Code License for Oracle Java SE technologies (BCL) and switched to a monthly, subscription-based plan for commercial use.

What changed?

Java SE, in its current subscription form, features additional support & functionality for mid- to large-scale enterprises (Flight Recorder, Mission Control & more). It also provides regular security updates, to ensure up-time & stability for their environment. Users can access updates for older releases of Java SE & receive commercial support. Remember – it includes the development kit & run-time.

Omitting the subscription would mean no updates, less security & stability – if you decide to stay on Java SE 8.

Publicly available patches for Oracle Java SE 8 stopped in January 2019, which left developers with two choices: get on board with the subscription that Oracle provides, or find an alternative to suit their needs.

Oracle JDK 8 is undergoing the “End of Public Updates” process, which means there are no longer free updates for commercial use after January 2019. However, since Java SE 9, Oracle is also providing Oracle’s OpenJDK builds which are free for commercial use, and there are free OpenJDK builds from other providers like AdoptOpenJDK, Azul, IBM, Red Hat, Linux distros et al.

Alternatives

OpenJDK

Developed by Oracle, with major input from a dedicated team and the Java community (including RedHat, IBM, Apple & others), this is the open-source, GPL licensed counterpart to Oracles solution. It will follow a 6-month release cycle by Oracle, in comparison to regular updates in the Java SE subscription plan.

Even though OpenJDK is based on Java SE and is, in fact, its open-source counterpart, it could, in theory, differ from Oracle JDK. This is due to the need to keep up with Java SE’s speed of performance & stability updates. Official updates are released every six months, while contributors can contribute at any time.

The only source code for OpenJDK is located here. However, certifications from Oracle for various flavors of the platform can be attained. This opens the door for companies which have their own OpenJDK implementations and distributions of the platform: Amazon, RedHat, SAP and many more.

Different sources argue, that OpenJDK may perform better than Oracle JDK, but have less stability & security – or vice versa. But for now, OpenJDK is as close to the original Oracle JDK as we can get.

GraalVM

We are mainly excited by GraalVM, due to its polyglot virtual machine. Imagine a single virtual machine, which supports all programming languages, interoperability between them and guarantees high performance for all.

Developers are able to use whatever language they want: Java, Groovy, Rust, C or Python & more.

This polyglot virtual machine can run as a standalone instance – embedded in OpenJDK and other platforms. This polyglot-mania extends into the four objectives of the Graal VM project:

  • Improve language performance
  • Reduced start-up time for applications
  • Enable Graal VM integration into custom embeddings like the Oracle Database
  • A free-form mix of code from any programming language into one program

When using Quarkus, the Supersonic Subatomic, Kubernetes native Java stack, you can tailor your future apps for GraalVM.

Keep an eye out on future developments of our Quarkus example in lighty-core.

For now, the consensus seems to be that the torch has been passed to OpenJDK, because of its proven stability over the years. However, GraalVM is a nice step forward and a wonderful concept, which we will follow closely.

So – what is its future?

Our own product, lighty.io, relies on Java. Juraj Veverka, PANTHEON.tech’s resident senior developer, managed to implement a simple example in Quarkus, which uses GraalVM.

We have mentioned two, out of over 20 available JVMs in this post. Bear in mind that lighty.io does not limit you in the choice of your favorite Java Virtual Machine.


You can contact us at https://pantheon.tech/

Explore our Pantheon GitHub.

Watch our YouTube Channel.

KubeCon - CloudNativeCon - PANTHEON.tech 2019

PANTHEON.tech @ KubeCon & CloudNative Con 2019

May 28, 2019/in Blog /by PANTHEON.tech

Barcelona is a wonderful city and home of several important conferences, which PANTHOEN.tech attended in the past. Rastislav Szabó & Tomáš Jančiga returned to Barcelona this year, to attend KubeCon & CloudNative Con.

With over 7700 participants, KubeCon was a massive event with lots of promising presentations. “KubeCon confirmed, that IT is moving towards cloud-native principles at high-speed”, according to Rastislav Szabó, who also held a presentation named “Network Observability with IPFIX, Prometheus and Elastic Stack“.

You can check out most of the presentations in the official KubeCon 2019 Presentation Playlist here. Many interesting topics were discussed, including CNF (Cloud Native Network Functions), Kubernetes usage & future, 5G and many more. “It is unbelievable, how many presentations we managed to go through. Each of them was a great experience – we caught up with several new trends and expanded our ideas for the future”.

KubeCon - CloudNativeCon 2019 Presentation
20190521 125906
20190521 125906
Demonstration at CloudNativeCon 2019

There were a lot of co-located events around KubeCon, which Rastislav and Tomáš could not have missed. “We were interested, as to how the tel-co industry sees these changes towards cloud-native principles. The co-located events were a perfect platform to answer our questions.” This also allowed our delegates to talk to a lot of people and to find out, how they perceive these shifts in IT.

“At the Cloud Native Network Services Day hosted by LFN, several notable presentations fulfilled our expectations. Vodafone and their take on Cloud-Native, Mellanox presented a vision of “Accelerating Container Networking”. Others, like Orange, Ericsson & Juniper also held their own presentations which we enjoyed”, according to Tomáš & Rastislav.

KubeCon - CloudNativeCon - PANTHEON.tech 2019 Exhibition Hall
ClouNativeCon Hallway 2019

As a fan of FD.io, Rastislav had to take part in the FD.io Mini Summit, which took place at the same time as KubeCon.

Another important session was the “Intro + Deep Dive BoF: Telecom User Group“, where a user-group, mailing list & GitHub repository for future collaboration were presented. The main message was, that tel-co is eager to step into the cloud-native world – but to get there, there are a lot of challenges and obstacles to overcome

We are sure, that here at PANTHEON.tech we would be more than happy to welcome new customers and present our idea of how this can be achieved.

“It was a wonderful experience and we are really looking forward to the next KubeCon & CloudNativeCon!”


You can contact us at https://pantheon.tech/

Explore our Pantheon GitHub.

Watch our YouTube Channel.

Ansible AWX featured

[How-To] Use AWX and Ansible for Automation & SFC in a multi-tenant Edge & DC environment

April 29, 2019/in Blog /by PANTHEON.tech

Ansible is a powerful automation tool, widely used by administrators for the automation of configuration and management of servers.

It started being adopted by network engineers as a tool for automation of configuration and management of networking devices (bare metal or virtual). Steps of the specific automated process are implemented as tasks, defined in YAML format. Tasks can be grouped into roles with other tasks and are executed as so-called plays, defined in another YAML file called playbook.

Playbooks also associate definitions of variables and list of hosts, where the roles and tasks will be performed. All of the mentioned (tasks, roles, playbooks, variables, hosts) can be specified as YAML files with a well-defined directory structure.

CONTACT US FOR A CUSTOM INTEGRATION

This makes Ansible suitable to be used as a base of Infrastructure as Code (IaC) approach to configuration management and orchestration in the telco industry, data centers (orchestration of virtualization and networking) & many more.

1

Figure A: An Ansible Playbook example structure

Ansible playbook structure

AWX provides UI and REST API on top of Ansible and also adds the management of inventories (lists of hosts and groups of hosts), credentials (SSH & more) integration with CVS (Code Versioning Systems, e.g.: Git).

In AWX, you can define job templates, which associates playbooks with repositories, credentials, configuration, etc. and you can execute them. The job templates can be used to build graphs, defining the order of execution of multiple job templates (sequentially or in parallel). Such graphs are called workflows and they can use job templates & other workflows as graph nodes.

2

Figure B: AWX WorkFlow and Job Templates

AWX WorkFlow and Job Templates

In our previous blogs, we have demonstrated the usage of SDN controller based on lighty.io as a controller of OVSDB capable devices and OpenFlow switches.

In this article, we’re going to describe some example Ansible playbooks and Ansible modules, using an SDN controller based on lighty.io. We will also be orchestrating Open vSwitch instances as a networking infrastructure of core data centers and edge data centers. This way, we are able to build solutions, utilizing Service Functions (SFs) and Service Function Chaining (SFC), which are dedicated to a specific tenant or particular service.


3

Figure 1: Data Center Simulation Setup

Data Center Simulation Setup

In the above Figure 1, we can see a topology of the testing setup, where 3 virtual machines are running in a Virtual Box and connected into an L2 switch, representing the underlay network.

Each VM has an IP address, configured from the same subnet. The two VMs simulate data centers or servers respectively. In each DC VM, there is an Open vSwitch installed and running without any configuration (using the default configuration, which will be overridden by our SDN controller), together with ovs-vsctl and ovs-ofctl utilities.

In the management VM, Ansible and AWX are installed & running. Also, an SDN controller based on lighty.io. using OVSDB and OpenFlow Southbound plugins and a RESTCONF northbound plugin is in the same VM.

This way, it is possible to use the SDN controller to manage and configure Open vSwitch instances over the HTTP REST API – according to RESTCONF specification and YANG models of OVSDB and OpenFlow plugins. See the implementation of Ansible roles and Ansible module for more details regarding specific RESTCONF requests usage.

In addition to the RESTCONF requests, Ansible uses also CLI commands over SSH to create namespaces, veth links and to connect them with a bridge instance created in respective Open vSwitch instance. OpeFlow flows are used as for configuration of rules forwarding packets from one port of virtual bride to another (and vice versa). All flow configurations are being sent as RESTCONF requests to the SDN controller which forwards them to the specific bridge of specific Open vSwitch instance.

Starting our Datacenters

We will also use a simple testing command for each DC VM. The command sends 3 ICMP echo requests from the tenant’s namespace, to the other tenant’s namespace in another DC VM. The requests are being sent in an infinite loop (using the watch command). Therefore, at first, they will show that the namespaces don’t exist (because they really don’t, according to Figure 1).

But after the successful provisioning and configuration of the desired virtual infrastructure, they should show that the ping command was successful, as we will demonstrate later.

Figure 2 and Figure 3 show an example of the output of the testing commands.

DataCenter-1:

watch sudo ip netns exec t1-s1 ping -c 3 10.10.1.2
4

Figure 2 for DataCenter-1

DataCenter-2:

watch sudo ip netns exec t1-s2 ping -c 3 10.10.1.1
5

Figure 3 for DataCenter-2

The playbooks and the Ansible module made for this demo can be executed directly from CLI (see README.md) or used with AWX. We have made a workflow template in AWX, which executes playbooks in the correct order. You can see the graph of execution in Figure 4:

6

Figure 4: Graph of Playbook Execution

Tenant provisioning with SFC and vFW SF workflow execution

After successful execution of the workflow, we have a provisioned and configured network namespace in each DC VM, which is connected to the newly created bridge in each respective Open vSwitch. There’s also another namespace in DC-1 VM which is connected to the bridge while using two veth links.

  • One link for traffic to/from tenant’s namespace
  • One for traffic to/from the tunnel interface

The tunnel interface is also connected to the bridge and uses the VXLAN ID 123. The bridge in each Open vSwtich instance is configured by adding OpenFlow flows forwarding packets between ports of the bridge. The network namespace in the DC 1 VM called v-fw, is used for an SF, which implements a virtual firewall using Linux bridge (br0) and iptables.

After provisioning of the SF, both veth links are connected into the Linux bridge and iptables are empty so all packets (frames) can traverse the virtual firewall SF. The resulting system is displayed in Figure 5.

7

Figure 5 – Resulting structure of our system

Resulting system after successful provisioning

Now, if we would check the testing ping commands, we can see that the ICMP packets are able to reach the destination, see Figure 6. and Figure 7.

8

Figure 6 – Successful ping commands in each direction (DataCenter-1)

9

Figure 7 – Successful ping commands in each direction (DataCenter-2)

The Path of ICMP Packets

In Figure 8, there are details of OpenFlow flows configured during provisioning in each bridge in the Open vSwtich instances.

The ICMP packet is not the first packet in communication, initiated by the ping command. It is an ARP broadcast, which traverses the same path as ICMP packets.

Here’s a description of the path traversed by ICMP packets from t1-s1 to t1-s2:

  1. ICMP request message starting from the namespace t1-s1, with the destination in t1-s2. It is forwarded from veth1 interface of t1-s1 and received in the interface t1-s1-veth1 of the bridge t1-br1
  2. There is a configured flow, which forwards every single L2 frame (not only L3 packet) received at port t1-s1-veth1, to the port v-fw-veth2. This is connected into the v-fw namespace
  3. The packet is received at veth2 of v-fw and is forwarded by br0 to veth3. Since there aren’t any iptables rules configured yet, the packet is forwarded through veth3 outside the v-fw SF
  4. The packet is received at v-fw-veth3 port of t1-br1 and there is an applied rule for forwarding each packet (frame) received at v-fw-veth3, directly to the tun123 port
  5. The port tun123 is a VXLAN tunnel interface, with VNI (VXLAN Network Identifier) set to 123. Each L2 frame traversing the tun123 port is encapsulated into VXLAN frame (outer Ethernet, IP, UDP and VXLAN headers are added before the original – inner – L2 frame)
  6. Now the destination IP address of the packet becomes 192.168.10.20 (according to the configuration of the VXLAN tunnel interface) and is forwarded by the networking stack of the DC-1 VM’s host OS, through the enp0s8 interface to the underlying network
  7. The underlying network forwards the packet to DC-2 VM, through the enp0s8 and the host OS networking stack. It finally reaches the tun123 interface of the bridge t1-br2
  8. The VXLAN packet is decapsulated and the original ICMP packet is forwarded from tun123 to t1-s2-veth1, according to the OpenFlow flows in t1-br2
  9. Now, it is received in t1-s2 at the interface of veth1 and processed by the networking stack in the namespace. The ICMP echo reply is sent through the same path back to the t1-s1 in the DC-1 VM
10

Figure 8: Detail of the OpenFlow flows configured in the bridges in Open vSwitch instances

Using the iptables as a Virtual Firewall

Now, we can use the Virtual Firewall SF and apply some iptables rules to the traffic, generated by the ping commands. Here is an example of the command, submitted at DC1 VM, which executes the iptables command in the v-fw namespace. The iptables command adds a rule to the FORWARD chain, which drops an ICMP echo (request) packets and the rule is applied at veth3 interface:

sudo ip netns exec v-fw iptables -A FORWARD -p icmp --icmp-type 8 -m state --state NEW,ESTABLISHED,RELATED -m physdev --physdev-in veth3 -j DROP

Result of this rule can be seen in Figure 9 and Figure 10. The ICMP traffic has now dropped. Not only in case of direction from DC2 to DC1, but also in the reverse direction (from DC1 to DC2), which also works.

11

Figure 9: The ping commands after the iptables role applied (DataCenter-1)

12

Figure 10: The ping commands after the iptables role applied (DataCenter-2)

Ansible playbooks & module

We’re going to take a closer look at the playbooks. These are used for the provisioning of the infrastructure above. We will follow the graph from Figure 4, where the workflow template execution is shown. The template only executes job templates, which are associated with exactly one playbook.

Each playbook made for this demo uses the same configuration structure, which has been designed to be easily extensible and re-usable for other scenarios, which use the same playbooks.

See the following block, showing the example configuration used for this demo. The same configuration in JSON format is stored in our repository, as cfg/cfg_example.json. Here are the main decisions, which will help us to achieve the desired re-usability:

  1. The configuration contains a list of configurations for each DC, called cfg_list. The playbook performs a lookup of the specific configuration, according to items “id” or “tun_local_ip“, which must match with the DC’s hostname or IP address respectively
  2. The single cfg_list item related to specific DC may include a configuration of SFC as “sf_cfg” item. If this configuration exists, then the SFC provisioning playbook (apb_set_chaining.yaml) will be executed for this DC (DC1 is an example in this demo)
  3. For the DC which doesn’t have specific SFC configuration, simple provisioning (apb_set_flows.yaml) is used, which interconnects tenant’s namespace with the tunnel interface (DC2 is an example in this demo)
ansible_sudo_pass: admin
sdn_controller_url: 'http://192.168.10.5:8888'
cfg_list:
  - id: swdev-dc-1
    bridge_name: t1-br1
    topology_id: 1
    of_ctrl: 'tcp:192.168.10.5:6633'
    server_name: t1-s1
    server_ip: 10.10.1.1
    server_veth: veth1
    server_of_port_id: 100
    tun_vxlan_id: 123
    tun_local_ip: 192.168.10.10
    tun_remote_ip: 192.168.10.20
    tun_of_port_id: 200
    sf_cfg:
      sf_id: v-fw
      con_left:
        name: veth2
        port_id: 10
      con_right:
        name: veth3
        port_id: 20
  - id: swdev-dc-2
    bridge_name: t1-br2
    topology_id: 2
    of_ctrl: 'tcp:192.168.10.5:6633'
    server_name: t1-s2
    server_ip: 10.10.1.2
    server_veth: veth1
    server_of_port_id: 100
    tun_vxlan_id: 123
    tun_local_ip: 192.168.10.20
    tun_remote_ip: 192.168.10.10
    tun_of_port_id: 200

Job Template Descriptions

Here is a short description of each job template & related playbook together, with the source code of the playbook. These include more detailed comments regarding the steps (tasks and roles) executed by each play of the playbook:

1. SET_001_SDN_tenant_infra is the job template which executes playbook apb_set_tenant.yaml. This playbook creates and connects tenant’s namespaces, bridges, veth links and VXLAN tunnel. See Figure 11, for how does the system look like after the execution of this playbook.

13

Figure 11: The state of the infrastructure after the execution of SET_001_SDN_tenant_infra template

# Read the configuration of the current host and create tenant's namespace and veth.
# Connect one end of the veth to the namespace and configure IP address and set the
# interface UP.
# Configure also OVS to use SDN controller as OVSDB manager.
- hosts: all
  serial: 1
  roles:
    - read_current_host_cfg
    - set_tenant_infra
 
# Send request to the SDN controller which connects the SDN controller to the OVS.
# Use SDN controller to create tenant's bridge in the OVS and connect
# the veth also into the bridge.
# Create also tunnel interface using VXLAN encapsulation and connect
# it to the bridge. (Linux kernel of the host OS will take care of
# forwarding packets to/from the tunnel)
- hosts: all
  connection: local
  serial: 1
  roles:
    - set_tenant_infra_cfg
 
# Setup OpenFlow connection from the bridge in OVS to the SDN controller.
# It must be done here because when the bridge connects to OpenFlow controller it deletes
# all interfaces and flows configured previously
- hosts: all
  serial: 1
  roles:
    - role: cfg_ovs_br_ctrl
      when: current_host_cfg.of_ctrl is defined

2. SET_002_SF_chaining executes playbook apb_set_chaining.yaml, which is executed for hosts which have specified the “sf_cfg” item in their configuration so in this demo it is DC1 only. This playbook runs in parallel with the SET_002_tenant_flows template and it creates a namespace for SF and required two veth links and connections. The playbook also configures the corresponding OpenFlow flows in the bridge.

See Figure 12, where you can see the difference after the successful execution.

14

Figure 12: The state of the infrastructure after the execution of SET_002_SF_chaining template

# Find the configuration for the current host and configure SFC infrastructure
# if the configuration contains item: sf_cfg
# The SFC infrastructure consists of two veth links and one namespace for the SF.
# Connect both links to the SF namespace by one side and to the tenant's bridge by
# the other side. Set links to UP state.
- hosts: all
  roles:
    - read_current_host_cfg
    - role: set_sf_chaining_infra
      vars:
        con_defs:
          - "{{ current_host_cfg.sf_cfg.con_left }}"
          - "{{ current_host_cfg.sf_cfg.con_right }}"
      when: current_host_cfg.sf_cfg is defined
 
# Use the SDN controller to configure OpenFlow flows which set up the forwarding
# of packets between ports in the tenant's bridge (veth links and the VXLAN tunnel).
- hosts: all
  connection: local
  roles:
    - role: set_sf_chaining_cfg
      when: current_host_cfg.sf_cfg is defined

3. SET_002_tenant_flows executes playbook apb_set_flows.yaml which is executed for hosts, which don’t have the “sf_cfg” item specified in their configuration, in this demo it is DC2. This playbook is executed parallel to SET_002_SF_chaining template and it just configures OpenFlow flows in the bridge, since everything has already been created and connected by SET_001_SDN_tenant_infra template. See Figure 13.

15

Figure 13: The state of the infrastructure after the execution of SET_002_tenant_flows template

# When the sf_cfg item of the current host's configuration is not defined then
# use the SDN controller and configure simple flows forwarding packets between
# veth link and the VXLAN tunnel interface.
- hosts: all
  connection: local
  roles:
    - read_current_host_cfg
    - role: set_tenant_flows
      when: current_host_cfg.sf_cfg is not defined

4. SET_003_SF_bridge is the job template, executing apb_set_bridge.yaml playbook. This creates a Linux bridge in the SF namespace for hosts with the “sf_cfg” defined. Both veth links of the SF namespace are connected to the Linux bridge. See Figure 14.

16

Figure 14: The state of the infrastructure after the execution of SET_003_bridge template

# Create linux bridge in the SF namespace and connect veth links to the
# linux bridge and set the bridge UP.
- hosts: all
  roles:
    - read_current_host_cfg
    - role: create_bridge_in_ns
      vars:
        net_ns_name: "{{ current_host_cfg.sf_cfg.sf_id }}"
        int_list:
          - "{{ current_host_cfg.sf_cfg.con_left.name }}"
          - "{{ current_host_cfg.sf_cfg.con_right.name }}"
      when: current_host_cfg.sf_cfg is defined

Playbooks used in this demo are not idempotent, so they can’t be executed successfully multiple times in a row. Instead, we have implemented two groups of playbooks.

One group sets all the stuff used in this demo. Another group deletes and un-configures everything and ignores possible errors of particular steps (tasks) so you can use it for cleaning of the setup, if necessary.

De-provisioning

We have also implemented three playbooks, which delete changes made by the provisioning playbooks. We have created a workflow in AWX running these playbooks in the correct order.

See the playbook sources and the README.md file for more information.

17

Figure 15: Tenant de-provisioning with SFC and vFW SF workflow execution

Multitenancy and isolation

In Figure 16, there’s an example where the second tenant is added. The tenant has two servers – one in each DC. The setup for the second tenant is simple, without SFC. As you can see the tenant has its own virtual bridge in each Open vSwitch instance.

IP addresses in the new tenant’s servers are identical with IP addresses in the first tenant servers. This is possible due to the traffic of each tenant being isolated, using extra virtual bridges and different VXLAN tunnels for each tenant or service.

The new tenant can be added, using the same group of playbooks and the same workflow template. The only thing which needs to be changed is the configuration used with the workflow template. See the example below in Figure 16.

18

Figure 16: After the second tenant is added

Configuration example for the second tenant provisioning:

ansible_sudo_pass: admin
sdn_controller_url: 'http://192.168.10.5:8888'
cfg_list:
  - id: swdev-dc-1
    bridge_name: t2-br1
    topology_id: 3
    of_ctrl: 'tcp:192.168.10.5:6633'
    server_name: t2-s1
    server_ip: 10.10.1.1
    server_veth: veth4
    server_of_port_id: 100
    tun_vxlan_id: 456
    tun_local_ip: 192.168.10.10
    tun_remote_ip: 192.168.10.20
    tun_of_port_id: 200
  - id: swdev-dc-2
    bridge_name: t2-br2
    topology_id: 4
    of_ctrl: 'tcp:192.168.10.5:6633'
    server_name: t2-s2
    server_ip: 10.10.1.2
    server_veth: veth4
    server_of_port_id: 100
    tun_vxlan_id: 456
    tun_local_ip: 192.168.10.20
    tun_remote_ip: 192.168.10.10
    tun_of_port_id: 200

Role of the SDN controller

In this demo, we have used an SDN controller based on lighty.io for the configuration of Open vSwitch instances over OVSDB and OpenFlow protocols. The usage of the SDN controller brings the following benefits:

1. Unified REST HTTP API: The data of orchestrated devices (in this case Open vSwitch instances) which allows building upper layer services using this API (e.g. dashboards, analytics, automation and more).

One example of such an application is OFP (OpenFlow Manager), already mentioned in our previous blog.

In Figure 17, a screenshot of the Web UI of the OpenFlow is shown, shoving data into four OpenFlow bridges, which are configured after the second tenant has been added. You can see also details of specific flow matching, in port with the action of the type Output port.

2. Caching: The controller allows for caching of the state and configuration of the orchestrated device. The cached configuration can be persistently stored and pushed into the device after re-start of the managed device.

3. Addition logic implementation:e.g. monitoring, resource management, authorization, and accounting or decision making according to an overview of the whole network.

4. Additional deployment: Controllers can be deployed as a geo-distributed clustered registry of multi-vendor networking devices, of the whole core DC network, backbone networks or Edge DC networks.

This way, you can access all the data you need from all of your networking devices, on the path from the core DC to the edge and RAN (Radio Access Network).

5. Underlay Networking: The SDN controllers, based on lighty.io, can be used not only for configuration, orchestration, and monitoring of virtualized networking infrastructure and overlay networking, but also for underlay networking.

19

Figure 17: Screenshot of the OFM WEB UI, of the SDN controllers OpenFlow data

What have we done today?

We have demonstrated the usage of Ansible, AWX and an SDN controller based on lighty.io, for automation of provisioning of services for multi-tenant data centers.

We have implemented Ansible playbooks and modules for orchestration of virtualized networking infrastructure and provisioning of tenant’s containers (simulated by namespaces). The playbooks and the module can be re-used for multiple use cases and scenarios an can be extended according to specific needs.

You could see how to utilize Open vSwitch and its OpenFlow capable virtual bridges for the creation of an isolated, virtual network infrastructure and Service Function Chaining (SFC). Open vSwitch bridges can be replaced by any OpenFlow capable switch (virtual or bare metal) in real deployments in core data centers or at the edge.

Also, networking devices without OpenFlow support can be used if they implement some “SDN ready” management interface, e.g.: NETCONF, RESTCONF or gNMI.

All of the components used in this demo, including the SDN controller, can be easily integrated into microservices architectures and deployed as Cloud Native applications (services).

Adding upper layer services (dashboards, monitoring, automation, business logic, etc.) you can continuously build solutions for your SDN networks, edge computing or 5G networks.

If you’re interested in a commercial solution, feel free to contact us.

Tomáš Jančiga


You can contact us at https://pantheon.tech/

Explore our Pantheon GitHub.

Watch our YouTube Channel.

lighty.io BGP Route Reflector featured

[lighty.io] BGP Route Reflector

April 23, 2019/in Blog /by PANTHEON.tech

The main goal of this project is to create a Docker container, that can be connected to an existing network and provide route-reflector functionality. We are using OpenDaylight-BGP plugin for this demonstration.

What is a BGP route-reflector?

The Border Gateway Protocol (BGP) is a routing protocol, designed for TCP/IP internets. Since the Internal BGP (IBGP) peers must follow the rule:

“don’t forward routing information received from one  IBGP peer to another IBGP peer”

To prevent loops, all BGP speakers within a single autonomous system must be fully meshed. This way, external routing information can be re-distributed to all other routers within that autonomous system. This operation often represents a serious scaling problem.

The design of a method known as “route reflection“ was introduced, to alleviate the need for “full mesh” peering.

This approach allows one IBGP to act as a route-reflector and all IBGP peers will send routing information only to that peer. This peer will, in turn, forward it to all other peers. A full-mesh topology is changed to a star topology.

Some background on Networking

Let’s take an example of the following topology:


topology

BGP Router Reflector Topology – Example

Firstly, let’s break down what we see in the picture. We have 4 docker containers connected with two docker networks. Typically, networks with 2 nodes connected use /31 or /30 masks. However, since Docker also connects the host to the network (with .1 host address), these masks are not applicable in this case.

We will use Docker auto-generated networks in this example.

cEOS Nodes

cEOS (containerized EOS) is an operating system for network devices from Arista (similar to IOS from Cisco). cEOS with “common” CLI, distribution and a Docker container, provides an easy to use solution for this demo. An important thing for this example is, that cEOS creates a port for every ethX port (except eth0), which is bridged with it. It automatically names it etX. These newly created etX ports are accessible and configurable from cEOS Cli and on start are in switching mode (meaning they don’t have an IP address assigned). We will come back to these ports during the configuration part.

If you are interested in how cEOS works you can find is here and the Cli command here.

Addresses for this example are as follows:

net1 (172.18.0.0/16)

  • 172.18.0.1 – host, assigned automatically on network creation
  • 172.18.0.2 – cEOS1, first container started in the network, assigned automatically on start
  • 172.18.0.3 – cEOS2, second container started in the network, assigned automatically on start
  • 172.18.0.4 – lighty–bgp, third container started in the network, assigned automatically on start
  • 172.18.0.5 – cEOS1, configured manually via CLI
  • 172.18.0.6 – cEOS2, configured manually via CLI

net2 (172.19.0.0/16)

  • 172.19.0.1 – host, assigned automatically on network creation
  • 172.19.0.2 – cEOS1, first container started in the network, assigned automatically on start
  • 172.19.0.3 – cEOS3, second container started in the network, assigned automatically on start
  • 172.19.0.4 – cEOS1, configured manually via CLI
  • 172.19.0.4 – cEOS3, configured manually via CLI

Additionally, we are using loopbacks to simulate connected networks, which will be the target of routing information exchange and serve us as a connectivity test tools:

  • cEOS1 – 192.168.1.0/24
  • cEOS2 – 192.168.2.0/24
  • cEOS3 – 192.168.3.0/24

Routing

Our goal is to be able to reach the loopback networks between themselves. For that, we need BGP to advertise loopback networks between nodes.

In this example, we are using two autonomous systems to have both types of peers (IBGP and EBGP).

  • AS 50 –   cEOS1, cEOS2, lighty bgp
  • AS 60 – cEOS3

To demonstrate route-reflector functionality cEOS1 and cEOS2 doens’t make a IBGP pair but create pair with lighty-bgp instead which act as a route-reflector. cEOS1 and cEOS3 creates EBGP pair.

Container with lighty-bgp MUST NOT be used as forwarding node, since it doesn’t know how to manipulate the routing table.

Prerequisites

lighty-BGP plugin

The plugin provides a “starting point” for ODL BGP bundles. We will use a Docker image, linked also in the next steps.

Learn more about lighty.io.

ODL BGP

BGPCEP module in ODL is capable to act as a BGP peer.

It provides the following features:

  • Establish peer connection
  • Receive routing information from a peer, apply policies and store it in routing information base (RIB)
  • Forward routing information to connected peers
  • Act as a route-reflector
  • Route injection

Unsupported operations:

  • Best path computation
  • Making changes in the routing table

Configuration

0. Before continuing, make sure that you have Docker and Postman installed.

1. Download the lighty BGP Docker image. PANTHEON.tech has its own docker repository, where you can access the image.

sudo docker pull pantheontech/lighty-rr

2. Download the Docker image of arista cEOS  (I was using version 4.20.5F) and install it as ceosimage:4.20.5F:

sudo docker import cEOS-lab.tar.xz ceosimage:4.20.5F

Prepare the Docker environment for our demo:

a) Create Docker networks:

sudo docker network create net1
sudo docker network create net2

b) Create containers:

sudo docker create --name=bgp -- priviledged -e INTFTYPE=eth -i -t pantheontech/lighty-rr:9.1.2.-dev
sudo docker create --name=ceos1 --privileged -e CEOS=1 -e container=docker -e EOS_PLATFORM=ceossim -e SKIP_ZEROTOUCH_BARRIER_IN_SYSDBINIT=1 -e ETBA=1 -e INTFTYPE=eth -i -t ceosimage:4.20.5F /sbin/init
sudo docker create --name=ceos2 --privileged -e CEOS=2 -e container=docker -e EOS_PLATFORM=ceossim -e SKIP_ZEROTOUCH_BARRIER_IN_SYSDBINIT=1 -e ETBA=1 -e INTFTYPE=eth -i -t ceosimage:4.20.5F /sbin/init
sudo docker create --name=ceos3 --privileged -e CEOS=3 -e container=docker -e EOS_PLATFORM=ceossim -e SKIP_ZEROTOUCH_BARRIER_IN_SYSDBINIT=1 -e ETBA=1 -e INTFTYPE=eth -i -t ceosimage:4.20.5F /sbin/init

c) Connect containers with networks:

sudo docker network connect net1 ceos1
sudo docker network connect net1 ceos2
sudo docker network connect net1 bgp
sudo docker network connect net2 ceos1
sudo docker network connect net2 ceos3

d) Start containers (prevent arp flux):

sudo docker start ceos1
sudo docker start ceos2
sudo docker start ceos3
sudo docker start bgp
sudo docker exec -ti ceos1 sysctl net.ipv4.conf.all.forwarding=1

Right now, we have our environment ready. We can check available ports in the container:

~$ sudo docker exec ceos1 ip addr
1: lo: <LOOPBACK,UP,LOWER_UP> mtu 65536 qdisc noqueue state UNKNOWN group default qlen 1000
    link/loopback 00:00:00:00:00:00 brd 00:00:00:00:00:00
    inet 127.0.0.1/24 scope host lo
       valid_lft forever preferred_lft forever
    inet6 ::1/128 scope host
       valid_lft forever preferred_lft forever
2: fwd0: <BROADCAST,MULTICAST,NOARP,UP,LOWER_UP> mtu 1488 qdisc pfifo_fast state UNKNOWN group default qlen 1000
    link/ether f2:f8:bb:5f:77:bd brd ff:ff:ff:ff:ff:ff
    inet6 fe80::f0f8:bbff:fe5f:77bd/64 scope link
       valid_lft forever preferred_lft forever
3: et1: <BROADCAST,MULTICAST,UP,LOWER_UP> mtu 9214 qdisc pfifo_fast state UP group default qlen 1000
    link/ether 02:42:ac:11:3e:b8 brd ff:ff:ff:ff:ff:ff
4: et2: <BROADCAST,MULTICAST,UP,LOWER_UP> mtu 9214 qdisc pfifo_fast state UP group default qlen 1000
    link/ether 02:42:ac:11:3e:b8 brd ff:ff:ff:ff:ff:ff
5: fabric: <BROADCAST,MULTICAST,UP,LOWER_UP> mtu 10000 qdisc pfifo_fast state UNKNOWN group default qlen 1000
    link/ether 02:42:ac:11:3e:b8 brd ff:ff:ff:ff:ff:ff
    inet6 fe80::42:acff:fe11:3eb8/64 scope link
       valid_lft forever preferred_lft forever
6: eth0@if7: <BROADCAST,MULTICAST,UP,LOWER_UP> mtu 1500 qdisc noqueue state UP group default
    link/ether 02:42:ac:11:00:02 brd ff:ff:ff:ff:ff:ff link-netnsid 0
    inet 172.17.0.2/16 scope global eth0
       valid_lft forever preferred_lft forever
    inet6 fe80::42:acff:fe11:2/64 scope link
       valid_lft forever preferred_lft forever
7: cpu: <BROADCAST,MULTICAST,UP,LOWER_UP> mtu 1500 qdisc pfifo_fast state UNKNOWN group default qlen 1000
    link/ether 22:ff:2a:84:50:f2 brd ff:ff:ff:ff:ff:ff
    inet6 fe80::20ff:2aff:fe84:50f2/64 scope link
       valid_lft forever preferred_lft forever
8: eth1@if9: <BROADCAST,MULTICAST,UP,LOWER_UP> mtu 1500 qdisc noqueue state UP group default
    link/ether 02:42:ac:12:00:02 brd ff:ff:ff:ff:ff:ff link-netnsid 0
    inet 172.18.0.2/16 scope global eth1
       valid_lft forever preferred_lft forever
    inet6 fe80::42:acff:fe12:2/64 scope link
       valid_lft forever preferred_lft forever
10: eth2@if11: <BROADCAST,MULTICAST,UP,LOWER_UP> mtu 1500 qdisc noqueue state UP group default
    link/ether 02:42:ac:13:00:02 brd ff:ff:ff:ff:ff:ff link-netnsid 0
    inet 172.19.0.2/16 scope global eth2
       valid_lft forever preferred_lft forever
    inet6 fe80::42:acff:fe13:2/64 scope link
       valid_lft forever preferred_lft forever

Here, we can see both eth and et port we mentioned earlier. et ports don’t have an IP address, because we didn’t configure it yet.

In this state, only connections to directly connected networks are working.

Configure Arista nodes

Firstly, configure IP addresses to etX ports from the topology picture are created by EOS and only accessible from CLI. Therefore, we are using IP addresses from etX ports.

Then, configure BGP and BGP neighbors. Furthermore, configure EBGP neighbors (different AS) between:

  • cEOS1 and cEOS3
  • IBGP neighbors between cEOS1, cEOS2 & lighty-BGP

The following command doesn’t work as copy-paste. The first command must be executed separately and the rest may be pasted:

  1. ceos1
    sudo docker exec -ti ceos1 Cli
    enable
    configure terminal
    hostname ceos1
    ip routing
    interface eth1
    no switchport
    ip address 172.18.0.5/16
    interface eth2
    no switchport
    ip address 172.19.0.4/16
    exit
    router bgp 50
    neighbor 172.18.0.4 remote-as 50
    neighbor 172.18.0.4 next-hop-self
    neighbor 172.19.0.5 remote-as 60
    neighbor 172.19.0.5 next-hop-self
    address-family ipv4
    neighbor 172.18.0.4 activate
    neighbor 172.19.0.5 activate
    exit
    exit
    exit
    exit
  2. ceos2
    sudo docker exec -ti ceos2 Cli
    enable
    configure terminal
    hostname ceos2
    ip routing
    interface eth1
    no swichport
    ip address 172.18.0.6/16
    exit
    router bgp 50
    neighbor 172.18.0.4 remote-as 50
    neighbor 172.18.0.4 next-hop-self
    address-family ipv4
    neighbor 172.18.0.4 activate
    exit
    exit
    exit
    exit
  3. ceos3
    sudo docker exec -ti ceos3 Cli
    enable
    configure terminal
    hostname ceos3
    ip routing
    interface eth1
    no switchport
    ip address 172.19.0.5/16
    exit
    router bgp 60
    neighbor 172.19.0.4 remote-as 50
    neighbor 172.19.0.4 next-hop-self
    address-family ipv4
    neighbor 172.19.0.4 activate
    exit
    exit
    exit
    exit

Now we have BGP configured and peering between cEOS1 and cEOS3 should be up. Rest of connections are idle.

~$ sudo docker exec -ti ceos1 Cli
ceos1>enable
ceos1#show ip bgp summary
BGP summary information for VRF default
Router identifier 172.19.0.4, local AS number 50
Neighbor Status Codes: m - Under maintenance
  Neighbor         V  AS           MsgRcvd   MsgSent  InQ OutQ  Up/Down State  PfxRcd PfxAcc
  172.18.0.4       4  50                 7         7    0    0 00:00:23 Connect       
  172.19.0.5       4  60                 7         7    0    0 00:03:57 Estab  0      0
ceos1#

Also, routing tables contain only directly connected routes:

~$ sudo docker exec -ti ceos1 Cli
ceos1>enable
ceos1#show ip route
 
VRF: default
Codes: C - connected, S - static, K - kernel,
       O - OSPF, IA - OSPF inter area, E1 - OSPF external type 1,
       E2 - OSPF external type 2, N1 - OSPF NSSA external type 1,
       N2 - OSPF NSSA external type2, B I - iBGP, B E - eBGP,
       R - RIP, I L1 - IS-IS level 1, I L2 - IS-IS level 2,
       O3 - OSPFv3, A B - BGP Aggregate, A O - OSPF Summary,
       NG - Nexthop Group Static Route, V - VXLAN Control Service,
       DH - DHCP client installed default route, M - Martian
 
Gateway of last resort is not set
 
 C      172.18.0.0/16 is directly connected, Ethernet1
 C      172.19.0.0/16 is directly connected, Ethernet2
 
ceos1#

5. Add some loopbacks to simulate networks and propagate them via BGP:

ceos1 -sudo docker exec -ti ceos1 Cli
enable
configure terminal
interface lo0
ip address 192.168.1.1/24
exit
router bgp 50
network 192.168.1.0/24
exit
exit
exit
ceos2 -sudo docker exec -ti ceos2 Cli
enable
configure terminal
interface lo0
ip address 192.168.2.1/24
exit
router bgp 50
network 192.168.2.0/24
exit
exit
exit
ceos3 -sudo docker exec -ti ceos3 Cli
enable
configure terminal
interface lo0
ip address 192.168.3.1/24
exit
router bgp 60
network 192.168.3.0/24
exit
exit
exit

Since we still didn’t configure lighty-bgp, we only receive the exchanged information between cEOS1 and cEOS3. Any connection from cEOS2 is still not registered:

~$ sudo docker exec -ti ceos1 Cli
ceos1>enable
ceos1#show ip route
 
VRF: default
Codes: C - connected, S - static, K - kernel,
       O - OSPF, IA - OSPF inter area, E1 - OSPF external type 1,
       E2 - OSPF external type 2, N1 - OSPF NSSA external type 1,
       N2 - OSPF NSSA external type2, B I - iBGP, B E - eBGP,
       R - RIP, I L1 - IS-IS level 1, I L2 - IS-IS level 2,
       O3 - OSPFv3, A B - BGP Aggregate, A O - OSPF Summary,
       NG - Nexthop Group Static Route, V - VXLAN Control Service,
       DH - DHCP client installed default route, M - Martian
 
Gateway of last resort is not set
 
 C      172.18.0.0/16 is directly connected, Ethernet1
 C      172.19.0.0/16 is directly connected, Ethernet2
 C      192.168.1.0/24 is directly connected, Loopback0
 B E    192.168.3.0/24 [200/0] via 172.19.0.5, Ethernet2
 
ceos1#

Since cEOS3 network is known to cEOS1, its connectivity should work:

~$ sudo docker exec -ti ceos1 Cli
ceos1>enable
ceos1#ping 192.168.3.1 source lo0
PING 192.168.3.1 (192.168.3.1) from 192.168.1.1 : 72(100) bytes of data.
80 bytes from 192.168.3.1: icmp_seq=1 ttl=64 time=18.1 ms
80 bytes from 192.168.3.1: icmp_seq=2 ttl=64 time=19.8 ms
80 bytes from 192.168.3.1: icmp_seq=3 ttl=64 time=67.5 ms
80 bytes from 192.168.3.1: icmp_seq=4 ttl=64 time=48.7 ms
80 bytes from 192.168.3.1: icmp_seq=5 ttl=64 time=30.8 ms
 
--- 192.168.3.1 ping statistics ---
5 packets transmitted, 5 received, 0% packet loss, time 85ms
rtt min/avg/max/mdev = 18.160/37.050/67.542/18.747 ms, pipe 3, ipg/ewma 21.436/27.970 ms
ceos1#

Be sure to use the ping command with “source lo0” part!

Without it, the source IP address will be taken from the outgoing port (172.19.0.2 in this case) and you could be misled, that cEOS3 knows about 192.168.2.0/24 network.

Just to verify that cEOS1 doesn’t know how to reach cEOS2 network:

~$ sudo docker exec -ti ceos1 Cli
ceos1>enable
ceos1#ping 192.168.2.1 source lo0
PING 192.168.2.1 (192.168.2.1) from 192.168.1.1 : 72(100) bytes of data.
From 192.168.1.1 icmp_seq=1 Destination Host Unreachable
From 192.168.1.1 icmp_seq=2 Destination Host Unreachable
From 192.168.1.1 icmp_seq=3 Destination Host Unreachable
From 192.168.1.1 icmp_seq=4 Destination Host Unreachable
 
--- 192.168.2.1 ping statistics ---
5 packets transmitted, 0 received, +4 errors, 100% packet loss, time 4015ms
pipe 4
ceos1#

Configure BGP

Here comes the crucial part. We will configure peers on lighty-BGP, which establishes a connection and performs routing information exchange. There is a lot of stuff to configure, so I am going to add comments to break it down a little here.

From lighty-BGP postman collection, use “BGP protocols” to configure BGP and neighbors.

Now, you can verify that all connections should be up & running:

~$ sudo docker exec -ti ceos1 Cli
ceos1>enable
ceos1#show ip bgp summary
BGP summary information for VRF default
Router identifier 172.19.0.4, local AS number 50
Neighbor Status Codes: m - Under maintenance
  Neighbor         V  AS           MsgRcvd   MsgSent  InQ OutQ  Up/Down State  PfxRcd PfxAcc
  172.18.0.4       4  50                33        37    0    0 00:00:53 Estab  1      1
  172.19.0.5       4  60                50        53    0    0 00:45:28 Estab  1      1
ceos1#show ip route
 
VRF: default
Codes: C - connected, S - static, K - kernel,
       O - OSPF, IA - OSPF inter area, E1 - OSPF external type 1,
       E2 - OSPF external type 2, N1 - OSPF NSSA external type 1,
       N2 - OSPF NSSA external type2, B I - iBGP, B E - eBGP,
       R - RIP, I L1 - IS-IS level 1, I L2 - IS-IS level 2,
       O3 - OSPFv3, A B - BGP Aggregate, A O - OSPF Summary,
       NG - Nexthop Group Static Route, V - VXLAN Control Service,
       DH - DHCP client installed default route, M - Martian
 
Gateway of last resort is not set
 
 C      172.18.0.0/16 is directly connected, Ethernet1
 C      172.19.0.0/16 is directly connected, Ethernet2
 C      192.168.1.0/24 is directly connected, Loopback0
 B I    192.168.2.0/24 [200/0] via 172.18.0.3, Ethernet1
 B E    192.168.3.0/24 [200/0] via 172.19.0.5, Ethernet2
 
ceos1#ping 192.168.2.1 source lo0
PING 192.168.2.1 (192.168.2.1) from 192.168.1.1 : 72(100) bytes of data.
80 bytes from 192.168.2.1: icmp_seq=1 ttl=64 time=9.67 ms
 
--- 192.168.2.1 ping statistics ---
5 packets transmitted, 1 received, 80% packet loss, time 47ms
rtt min/avg/max/mdev = 9.672/9.672/9.672/0.000 ms, ipg/ewma 11.772/9.672 ms
ceos1#

Furthermore, you can verify the advertised routes in BGP datastore with a second request in the collection. That is the GET “OPER rib” of BGP-rib entries.

7. Now, try to ping from ceos2|3 to ceos2|3

sudo docker exec -ti ceos[2|3] Cli
ena
ping 192.168.[2|3].1 source lo0

Conclusion

Route reflection provides the network with a feature for BGP speakers, to directly peer with a route reflector. We have successfully managed to simulate a route reflector with the help of the ODL-BGP plugin, lighty.io & some additional configuration.

If you’re interested in a commercial solution, feel free to contact us.

Matej Perina


You can contact us at https://pantheon.tech/

Explore our Pantheon GitHub.

Watch our YouTube Channel.

kolaz1 1030x984 2

PANTHEON.tech @ ONS 2019

April 16, 2019/in Blog /by PANTHEON.tech

Our PANTHEON.tech all-star team, comprised of Juraj Veverka, Martin Varga, Róbert Varga & Štefan Kobza visited the Open Networking Summit North America 2019 (ONS), in the sunny town of San Jose, California.

IMG 20190403 103024 min

In the span of 3 days, keynotes and presentations were held with notable personalities and companies from various network companies & technological giants.

“The networking part, was a welcoming mixture of old acquaintances & new faces interested in our products, solutions and in the company in general.”

“It was crucial to present our ideas, concepts & goals by short messages or few slides. Since the approximate time of our booth visit was 2-3 minutes, I had to precisely focus and point out why we matter.” (who is saying it?) This was not an easy task since there were companies like  Ericsson, Intel, Huawei or IBM at the conference.

Our Skydive/VPP Demo

“Before the actual conference, we were asked to come up with potential demo ideas, which would be presented at ONS. Our SkyDive – VPP Integration demo was accepted and opened the doors to a wide interest in PANTHEON.tech.” As Juraj recollects, after the keynote, waves of visitors swarmed the nearest booths, including ours and our Skydive – VPP Integration demo:

Skydive is an open-source, real-time network topology, and protocols analyzer. It aims to provide a comprehensive way of understanding what is happening in the network infrastructure.

We have prepared a demonstration topology containing running VPP instances. Any changes to the network topology are detected in real-time.

Juraj Veverka & Robert Varga @ ONS 2019

Skydive is a tool that can quickly show, what is currently happening in your network. VPP serves the purpose of fast packet processing, which is one of the main building blocks of a (virtual) network. If anybody wants a fast network – VPP is the way to go.

Connecting Skydive & VPP is almost a necessity, since diagnosing VPP issues is a lot more difficult without using Skydive. Skydive leads you towards the source of the issue, as opposed to the time-consuming studying of the VPP console.

The importance of this demo is based on the need to extract data from VPP. Since the platform does not easily provide the required output, this provides a birds-eye view on the network via Skydive.

“The Skydive demo was a huge hit. Since it was presented in full-screen and had its own booth, we gained a lot of attention due to this unique solution.” Attendees were also interested in our Visibility Package solution and what kind of support PANTHEON.tech could provide for their future network endeavors.

SkyDive Demo @ ONS 2019

Improvements & ONS 2020

“Inbetween networking, presenting and attending keynotes, we have managed to do some short sightseeing and enjoyed the city of San Jose a little bit. But of course, work could not have waited as we have been excited to come back to the conference atmosphere each day.”

But how was ONS 2019 in comparison to last years conference? “In comparison to last year, the Open Networking Summit managed to expand & increase in quality. We are glad that we made many new acquaintances, which we will hopefully meet again next year!”

We would like to thank the Linux Foundation Networking for this opportunity. See you next year!

IMG 6218 min

PyCon 2019 featured image

[PyConSK19] Automated visualization and presentation of test results

April 3, 2019/in Blog /by PANTHEON.tech

PANTHEON.tech’s developer Tibor Frank recently held a presentation at PyConSK19 in Bratislava. Here is his full-length presentation and some notes on top of it.

Motivation

Patterns, trends, and correlations that might remain undetected in text-based data can be exposed and recognized easier with data visualization.

Why do we need to visualize data? Because people like pictures and they hate piles of numbers. When we want or need to provide data to our audience, the best way how to communicate it is to display it. But we must display it in a form and structure our intended audience can consume. They must process the information in a fraction of second and in the correct way.

A real-world example

When I was building my house, a sales representative approached me and proposed, that he has the best thermal isolation for houses on the market.

He told me that it is 10% better than the second one and showed me this picture. Not a graph, a picture, as this is only a picture with one blue rectangle and two lines. From this point, I wasn’t interested in his product anymore. But I was curious about the price of this magic material. He told me that it is only 30% more expensive than the second one. Then I asked him to leave.

Of course, I was curious so I did some research later in the evening. I found the information about both materials and I visualized it with a few clicks in Excel.

thermal

What’s the difference between these two visualizations? The first one is good only as an illustration in marketing materials.

From a technician point of view, I am missing information about what the graph is trying to show me:

  • Title
  • Axes with titles
  • Numbers
  • Physical quantities
  • Legend

The same things which we were told to use at elementary school. It’s simple, isn’t it?

To be honest, this graph confirmed that his product is 10% better, but still, 30% more expensive.

Attributes of a good design

When we are talking about visualization we must also talk about design. In general, there are four attributes of a good design. It must be:

  • Beautiful –  because people must find pleasure in it
  • Gratifying – to enjoy it
  • Logical –  everything should be in the right place; it must be self-descriptive, no need for further explanation
  • Functional – the interactions between components must work and it must fit the bigger picture

Besides these attributes, we should choose the right point of view. Look at these two pictures. Which one do you like the best?

pyramids

Do we want to show details? Or a bigger picture? Or both?

We need to decide before we start according to the nature of data we visualize, the information we want to communicate and the intended audience.

We must ask ourselves who will be the customer for our visualized data.

  • Management
  • Marketing
  • Customers
  • Skilled professionals
  • Anyone

We should keep it in mind while preparing the visuals.

What do we visualize?

Data. Lots of data. 30GB of data, twice a day. Our data is the result of performance tests. I am working on an FD.io project which performs Continuous System and Integration Testing (CSIT) of the Vector Packet Processor (VPP). As I said, we focus on performance. The tests measure the packet throughput and packet latency in plenty of configurations of the VPP. For more information, visit FD.io’s website. 

The Fast Data Project So, what do we visualize?

1. Performance test results for the product release:

  • Packet throughput
  • Packet Latency
  • Speedup multi-core throughput – increase in performance if we increase the number of processor cores used for data processing

2.Performance over a defined time period:

  • Packet throughput trend

Where does the data come from?

csit design picture

FD.io CSIT hierarchy (https://docs.fd.io/)

Jenkins runs thousands of tests on our test-beds and provides the results as robot frameworks’ output.xml files. The files are processed and the data from them visualized. As a final step we use Sphinx to generate html pages which are then published on the web.

What we use

Nothing surprising, we use standard python tools:

  • Python 2.7 3.6
  • Numpy
  • Pandas
  • Plot.ly
  • Sphinx

I will not bother you with these tools, you might know them better than me.

Plots

We use Plot.ly in offline mode to generate various kinds of plots. Hundreds of dynamically generated plots are then put together by Sphinx to create the release Report or the Continuous Performance Trending.

I’ll start with the plots published in the Report. In general, we run all performance tests ten times to prevent any anomalies in the results. We calculate the mean value and standard deviation for all tests and then work with them.

Packet throughput – Statistical box plot

3

The elementary information about the performance is visualized by the statistical box plot. This kind of plot provides us all information about statistical data – minimum, first quartile, median, third quartile, maximum and outliers. This information is displayed in the hover box.

As you can see, the X-axis lists indices of individual test suites as listed in Graph Legend; and the Y-axis presents measured Packet throughput values [Mpps]. Both axes start with zero value so we know the scale. The tests in each plot are grouped and ordered by the chosen criteria. This grouping is written in the plot title (area, topology, processor architecture, NIC, frame size, number of cores, test type, measured property).

From this graph we can also see the variability of results – the results in the first graph are in all runs almost the same (there are lines instead of boxes), the results in the second one vary in a quite big range. It says that the reliability of these results are lower than in the first case and there might be an issue in the tested functionality, tests or infrastructure & more.

Packet Latency – Scatter plot with error bars

1 1

When we measure the packet latency, we get minimal, average and maximal values in both directions of data flows. The best way we found to visualize it, is the scatter plot with error bars.

The dot represents the average value and the error bars the minimum and maximum values.

The rest of the graph is similar to the previous one.

Speedup – Scatter plot with annotations

3 1

Speedup is the increase of the packet throughput if we increase the number of processor cores used for data processing. We measure the throughput using 1, 2 and 4 cores.

Again, we use the Scatter plot. The measured values are represented by dots connected by solid lines. In the ideal case, it would be a straight line. But it is not. So we added dashed lines to show how it would be in the ideal world. In real life, there are limitations not only in software but also in hardware. They are shown as dotted lines – Link, NIC, and PCIe bus limits. These limits cannot be overcome by the software.

3D Data

Capture 1

Some of our visualizations present three-dimensional data, in this example, the packet throughput is measured in a configuration with two changing parameters.

The easiest way to visualize it is to use excel and by a few clicks, we can create a graph like this one (above). It looks quite good but:

  • The orientation in the graph is not so easy. What if there were 20 samples in a row?
  • It is difficult to read the results
  • In some cases, which are very probable, some bars can be hidden behind another one
  • And Plot.ly does NOT support this kind of graph because, as they say, it is not needed. And they are right

So we had to look for a better solution. And we found the heat-map. It presents three-dimensional data in two-dimensional space. It is easy to process all information at one quick sight. We can quickly find any anomalies in this pattern as we expect the highest value to be in the top left corner and decreasing to the right and down.

3 2

Packet throughput trending – Scatter plot

5


The trending graphs show us the trend of packet throughput over the chosen time period which is 90 days in this case. The data points (again average value of 10 samples) are displayed as dots. The trend lines are calculated by JumpAvg algorithm developed by our colleague. It is based on the minimum description length (MDL) principle.

What is important in the visualization of a trend, are changes in the trend. We mark them by color circles: red for regression and green for progression. These changes in trend can be easily spotted by testers and/or developers so we immediately know the effect of merged changes on the product performance.

Tibor Frank

openflow and lighty and db

[lighty.io] OVSDB & OpenFlow Controller

March 28, 2019/in Blog /by PANTHEON.tech

OVSDB and OpenFlow controller based on lighty.io

PANTHEON.tech has recently published an example application of an SDN controller, using RESTCONF Northbound module and OVSDB + OpenFlow Southbound modules.

In this blog we are going to describe, how to use the SDN controller with an Open vSwitch instance running in OpenStack.

Open vSwitch, OVSDB & OpenFlow

Open vSwitch is open source virtual switch which uses OVSDB (Open vSwitch Database) and OVSDB management protocol for management of virtual OpenFlow switches referred to as bridges.

The bridges are configurable by OpenFlow protocol according to OpenFlow switch specification.

We have already written a blog about OpenFlow protocol and its support by lighty.io. There’s also example SDN controller application called lighty-community-restconf-ofp-app. It utilizes RESTCONF northbound module and OpenFlow southbound module only. You can find it at our GitHub repository.

Connecting to Open vSwitch of OpenStack

In this blog, we will show you some example setup and sequence of requests using both OVSDB and OpenFlow protocols implemented as SB modules in lighty.io.

We have published an example SDN controller called lighty-community-restconf-ovsdb-app, which utilizes RESTCONF northbound module and OVSDB southbound module only. You can check its README.md file and Postman collection for more details.

As we have already mentioned, Open vSwitch used in the testing setup is running in OpenStack. Here is a picture and description of the setup:

OpenStack Environment with lighty.io - Scheme

image2019 3 7 19 25 56

The SDN controller is running on a machine with IP address 10.14.0.160 with RESTCONF NB plugin & opening Port 8888.

  • Postman or curl requests are submitted from the same machine where SDN controller is running, so URLs use localhost address (127.0.0.1)
  • Open vSwitch instance is running on a machine with IP address 10.14.0.103 (the same address used in ovs-vsctl command explained above) The tested instance has been set up by DevStack scripts but it can be any Open vSwitch instance running in OpenStack Network node, compute node or outside of OpenStack.
  • TCP port used for OVSDB server(s) is 6640
  • TCP port used by OpenFlow server(s) is 6633

Example workflow

Subsequent requests can be found in the repository at GitHub, in the form of Postman collection. In the README.md & in this blog, we are using a curl command to send the RESTCONF requests. We are also using the Python module json.tool for printing of JSON responses.

1. Configure OVSDB manager of Open vSwitch

The following piece of the ovs–vsctl show command output shows the initial configuration of the Open vSwitch and its state, where we can see that the Neutron service is connected as OVSDB manager (Manager “ptcp:6640:127.0.0.1”). The Neutron service is also configured as OpenFlow controller for the bridge br-tun (Controller “tcp:127.0.0.1:6633”) and br-tun is connected to the controller.

sudo ovs-vsctl show
729321e6-991d-4ae5-a4f9-96b1e2919596
    Manager "ptcp:6640:127.0.0.1"
        is_connected: true
    Bridge br-tun
        Controller "tcp:127.0.0.1:6633"
            is_connected: true
        fail_mode: secure
        Port br-tun
            Interface br-tun
                type: internal
        Port patch-int
            Interface patch-int
                type: patch
                options: {peer=patch-tun}

Using this ovs-vsctl command we set up Open vSwitch to listen to second OVSDB manager connection at TCP port 6640 and an interface with IP address 10.14.0.103. The command keeps the configuration for Neutron service as OVSDB manager (ptcp:6640:127.0.0.1).

sudo ovs-vsctl set-manager ptcp:6640:127.0.0.1 ptcp:6640:10.14.0.103

The output of “ovs-vsctl show” command must be changed, as a result of the command above. There should be two managers configured, but only one of them is connected. The connected one is Neutron service and we have to start and configure the SDN controller, in order to initiate OVSDB connection from the controller’s side.

sudo ovs-vsctl show
729321e6-991d-4ae5-a4f9-96b1e2919596
    Manager "ptcp:6640:127.0.0.1"
        is_connected: true
    Manager "ptcp:6640:10.14.0.103"
    Bridge br-tun
        Controller "tcp:127.0.0.1:6633"
            is_connected: true
        fail_mode: secure
        Port br-tun
            Interface br-tun
                type: internal
        Port patch-int
            Interface patch-int
                type: patch
                options: {peer=patch-tun}

2. Setup OVSDB connection

This RESTCONF request results in OVSDB session initiation to the pre-configured OVSDB server in the Open vSwitch.

curl -v --request PUT \
  --url http://127.0.0.1:8888/restconf/data/network-topology:network-topology/topology=ovsdb%3A1/node=ovsdb%3A%2F%2FHOST1 \
  --header 'Authorization: Basic YWRtaW46YWRtaW4=' \
  --header 'Content-Type: application/json' \
  --data '{
        "network-topology:node": [
          {
            "node-id": "ovsdb://HOST1",
            "connection-info": {
              "ovsdb:remote-port": "6640",
              "ovsdb:remote-ip": "10.14.0.103"
            }
          }
        ]
      }'

You can check whether the session has been established using the “ovs-vsctl” show command. Both OVSDB managers should be connected now. You can also use the next RESTCONF request.

sudo ovs-vsctl show
729321e6-991d-4ae5-a4f9-96b1e2919596
    Manager "ptcp:6640:127.0.0.1"
        is_connected: true
    Manager "ptcp:6640:10.14.0.103"
        is_connected: true
    Bridge br-tun
        Controller "tcp:127.0.0.1:6633"
            is_connected: true
        fail_mode: secure
        Port br-tun
            Interface br-tun
                type: internal
        Port patch-int
            Interface patch-int
                type: patch
                options: {peer=patch-tun}

3. Retrieve OVSDB network topology data (all nodes)

Now, we are going to ask lighty.io (meaning the SDN controller) about the state of OVS. In this step, we are going to access the SDN controller through a RESTCONF request. The controller will then create a request via the OVSDB protocol and OVS will create the same request, as shown in OVS-VSCTL show.

This RPC request returns the same data as an output of the ovs-vsctl show command. But the show command returns text output. In case of RPC request, the output is formatted as JSON or XML (depending on the Accept header) what is more appropriate for API between software layers of SDN solutions (i.e.: RPCs returning JSON or XML formatted output of commands are SDN ready).

NOTE: In this state, the OVSDB connection between SDN controller and Open vSwitch is established. There’s also another connection which is used by Neutron service. You can check this in the output of ovs-vsctl show:

Manager "ptcp:6640:127.0.0.1"
    is_connected: true
Manager "ptcp:6640:10.14.0.103"
    is_connected: true

… and also in the output of RESTCONF request:

"ovsdb:manager-entry": [
    {
        "target": "ptcp:6640:127.0.0.1",
        "connected": true,
        "number_of_connections": 5
    },
    {
        "target": "ptcp:6640:10.14.0.103",
        "connected": true,
        "number_of_connections": 1
    }
]

The only OpenFlow connection(s) in this state are used by Neutron service, you can see it in the output of ovs-vsctl show:

    Bridge br-int
        Controller "tcp:127.0.0.1:6633"
            is_connected: true
    Bridge br-ex
        Controller "tcp:127.0.0.1:6633"
            is_connected: true
... and the same for other bridges

… and also in the output of RESTCONF request:

... all bridges should have:
                    "ovsdb:controller-entry": [
                        {
                            "target": "tcp:127.0.0.1:6633",
                            "controller-uuid": "de378546-d727-4631-8d46-fa57d78737d9",
                            "is-connected": true
                        }
                    ],

Here is an example of complete ovs-vsctl show command output:

sudo ovs-vsctl show
729321e6-991d-4ae5-a4f9-96b1e2919596
    Manager "ptcp:6640:127.0.0.1"
        is_connected: true
    Manager "ptcp:6640:10.14.0.103"
        is_connected: true
    Bridge br-tun
        Controller "tcp:127.0.0.1:6633"
            is_connected: true
        fail_mode: secure
        Port br-tun
            Interface br-tun
                type: internal
        Port patch-int
            Interface patch-int
                type: patch
                options: {peer=patch-tun}
    Bridge br-int
        Controller "tcp:127.0.0.1:6633"
            is_connected: true
        fail_mode: secure
        Port "tap2f509846-a3"
            tag: 4
            Interface "tap2f509846-a3"
                type: internal
        Port "qr-40a33ce6-dd"
            tag: 6
            Interface "qr-40a33ce6-dd"
                type: internal
        Port "tape9302402-e4"
            tag: 1
            Interface "tape9302402-e4"
                type: internal
        Port "tap63c483cb-87"
            tag: 6
            Interface "tap63c483cb-87"
                type: internal
        Port "tap960bd59d-2e"
            tag: 5
            Interface "tap960bd59d-2e"
                type: internal
        Port "tap74a59f96-94"
            tag: 3
            Interface "tap74a59f96-94"
                type: internal
        Port "qg-9285bad8-81"
            tag: 2
            Interface "qg-9285bad8-81"
                type: internal
        Port "tap3792b4af-27"
            tag: 7
            Interface "tap3792b4af-27"
                type: internal
        Port int-br-infra
            Interface int-br-infra
                type: patch
                options: {peer=phy-br-infra}
        Port "qr-9da1a177-1a"
            tag: 7
            Interface "qr-9da1a177-1a"
                type: internal
        Port "qg-7f8467e0-a4"
            tag: 2
            Interface "qg-7f8467e0-a4"
                type: internal
        Port "qr-7da2c452-59"
            tag: 1
            Interface "qr-7da2c452-59"
                type: internal
        Port "qg-5a4bd0e5-a0"
            tag: 2
            Interface "qg-5a4bd0e5-a0"
                type: internal
        Port patch-tun
            Interface patch-tun
                type: patch
                options: {peer=patch-int}
        Port int-br-ex
            Interface int-br-ex
                type: patch
                options: {peer=phy-br-ex}
        Port "qr-91d9970c-ef"
            tag: 1
            Interface "qr-91d9970c-ef"
                type: internal
        Port br-int
            Interface br-int
                type: internal
    Bridge br-ex
        Controller "tcp:127.0.0.1:6633"
            is_connected: true
        fail_mode: secure
        Port br-ex
            Interface br-ex
                type: internal
        Port phy-br-ex
            Interface phy-br-ex
                type: patch
                options: {peer=int-br-ex}
    Bridge br-infra
        Controller "tcp:127.0.0.1:6633"
            is_connected: true
        fail_mode: secure
        Port br-infra
            Interface br-infra
                type: internal
        Port phy-br-infra
            Interface phy-br-infra
                type: patch
                options: {peer=int-br-infra}
    ovs_version: "2.9.2"

The related RESTCONF request:

curl -v --request GET \
  --url http://127.0.0.1:8888/restconf/data/network-topology:network-topology/topology=ovsdb%3A1 \
  --header 'Authorization: Basic YWRtaW46YWRtaW4=' \
  --header 'Accept: application/json' \
  | python -m json.tool

The example output of the request can be found here. 

4. Retrieve specific node from OVSDB topology data (node-id: “ovsdb://HOST1”)

curl -v --request GET \
  --url http://127.0.0.1:8888/restconf/data/network-topology:network-topology/topology=ovsdb%3A1/node=ovsdb%3A%2F%2FHOST1 \
  --header 'Authorization: Basic YWRtaW46YWRtaW4=' \
  --header 'Accept: application/json' \
  | python -m json.tool

Since there’s only one OVSDB topology node in the SDN controller, the output contains the same data as in case of the previous request.

5. Retrieve OVSDB data of specific bridge (br-int):

curl -v --request GET \
--url http://127.0.0.1:8888/restconf/data/network-topology:network-topology/topology=ovsdb%3A1/node=ovsdb%3A%2F%2FHOST1%2Fbridge%2Fbr-int \
--header 'Authorization: Basic YWRtaW46YWRtaW4=' \
--header 'Accept: application/json' \
| python -m json.tool

This request returns only a subset of data related to the bridge br-int.

6. Setup SDN controller as OpenFlow controller for bridge br-int:

curl -v --request PUT \
  --url http://localhost:8888/restconf/data/network-topology:network-topology/topology=ovsdb%3A1/node=ovsdb%3A%2F%2FHOST1%2Fbridge%2Fbr-int \
  --header 'Authorization: Basic YWRtaW46YWRtaW4=' \
  --header 'Content-Type: application/json' \
  --data '{
            "network-topology:node": [
                  {
                    "node-id": "ovsdb://HOST1/bridge/br-int",
                       "ovsdb:bridge-name": "br-int",
                        "ovsdb:controller-entry": [
                          {
                            "target": "tcp:10.14.0.160:6633"
                          }
                        ]
                  }
              ]
          }'

 7. Check the state of the connection – retrieve the controller-entry list of br-int:

curl -v --request GET \
  --url http://localhost:8888/restconf/data/network-topology:network-topology/topology=ovsdb%3A1/node=ovsdb%3A%2F%2FHOST1%2Fbridge%2Fbr-int/controller-entry=tcp%3A10.14.0.160%3A6633 \
  --header 'Authorization: Basic YWRtaW46YWRtaW4=' \
  --header 'Accept: application/json' \
  | python -m json.tool

The GET request above only retrieves OVSDB data of OpenFlow connection between Open vSwitch and SDN controller. The output only contains one entry (if the OpenFlow connection is established then the item “is-connected” is set to true):

{
    "ovsdb:controller-entry": [
        {
            "controller-uuid": "5bfe55c9-70da-4e3b-b1ff-c6ecc8b6e62c",
            "is-connected": true,
            "target": "tcp:10.14.0.160:6633"
        }
    ]
}

In the output of ovs-vsctl show command or previous get requests to OVSDB, you will also see a connection between Open vSwitch and Neutron service:

"ovsdb:controller-entry": [
    {
        "target": "tcp:127.0.0.1:6633",
        "controller-uuid": "57b4a453-5ee5-40ea-953a-4132319ad1eb",
        "is-connected": true
    },
    {
        "target": "tcp:10.14.0.160:6633",
        "controller-uuid": "bc0af587-fc76-44d9-ab24-fe926b1099e6",
        "is-connected": true
    }
],

8. Retrieve network topology:

curl -v --request GET \
--url http://127.0.0.1:8888/restconf/data/network-topology:network-topology/topology=flow%3A1 \
--header 'Authorization: Basic YWRtaW46YWRtaW4=' \
--header 'Accept: application/json' \
| python -m json.tool

Here’s an example of the output, where you can find a node-id of the Open vSwitch instance. This can be used in subsequent requests.

9. Retrieve data of all nodes (reply includes also OpenFlow flow tables):

curl -v --request GET \
  --url http://127.0.0.1:8888/restconf/data/opendaylight-inventory:nodes \
  --header 'Authorization: Basic YWRtaW46YWRtaW4=' \
  --header 'Accept: application/json' \
  | python -m json.tool

Here’s is the output from our example.

10. Retrieve data of a specific node (reply includes also OpenFlow flow tables):

This request uses node-id in the URL. The node-id can be found in reply to requests 8. and 9.

curl -v --request GET \
  --url http://127.0.0.1:8888/restconf/data/opendaylight-inventory:nodes/node=openflow%3A143423481343818 \
  --header 'Authorization: Basic YWRtaW46YWRtaW4=' \
  --header 'Accept: application/json' \
  | python -m json.tool

11. Retrieve specific OpenFlow table of specific node:

curl -v --request GET \
--url http://127.0.0.1:8888/restconf/data/opendaylight-inventory:nodes/node=openflow%3A143423481343818/table=0 \
--header 'Authorization: Basic YWRtaW46YWRtaW4=' \
--header 'Accept: application/json' \
| python -m json.tool

12. Delete OpenFlow controller connection from Open vSwitch configuration of bridge br-int:

curl -v --request DELETE \
--url http://localhost:8888/restconf/data/network-topology:network-topology/topology=ovsdb%3A1/node=ovsdb%3A%2F%2FHOST1%2Fbridge%2Fbr-int/controller-entry=tcp%3A10.14.0.160%3A6633 \
--header 'Authorization: Basic YWRtaW46YWRtaW4='

13. Close OVSDB connection to the Open vSwitch instance:

curl -v --request DELETE \
--url http://127.0.0.1:8888/restconf/data/network-topology:network-topology/topology=ovsdb%3A1/node=ovsdb%3A%2F%2FHOST1 \
--header 'Authorization: Basic YWRtaW46YWRtaW4='

OpenFlow manager (OFM)

For this setup, you can also use the OFM application, which provides GUI for management of OpenFlow switches. You can connect OFM to the controller and retrieve OpenFlow tables of a specific switch – plus the flows will be graphically displayed. You can also modify existing flows, or add new using OFM. See our blog about OpenFlow integration.

Conclusion

In this blog, we have described the use of an SDN controller with OVSDB and OpenFlow support. It can be used to manage Open vSwitch virtual switches. We have used Open vSwitch running in an OpenStack environment and we described the sequence of requests needed to connect SDN controller to OVSDB and OpenFlow interfaces of Open vSwitch.

This approach can be used to manage Open vSwitch instances, running in OpenStack Network nodes and Compute nodes without breaking the connection between Neutron service and the Open vSwitch instances. But the SDN controller example and described requests can be used with any virtual or physical network device supporting OpenFlow or OVSDB or both protocols.

The usage of RESTCONF SB plugin in the SDN controller means, that any application can implement RESTCONF (HTTP/REST/API) client and communicate with the controller, as we have demonstrated by Postman application and OpenFlow manager (OFM) in the previous blog.

openflow and lighty

[lighty.io] OpenFlow Integration

March 14, 2019/in Blog /by PANTHEON.tech

lighty.io 9.2.x provides examples of OVSDB & OpenFlow SDN controllers for integration with your SDN solution. Those examples will guide you through lighty.io controller core initialization, with OVSDB and/or OpenFlow southbound plugins attached. You can use those management protocols with a really small memory footprint and simple runtime packaging.

Today, we will show you how to run and integrate the OpenFlow plugin in lighty.

What is OpenFlow?

OpenFlow (OF) is a communications protocol, that gives access to the forwarding plane of a network switch or router over the network. OpenFlow can be applied for:

  • Quality of Service measurement by traffic filtering
  • Network monitoring (i.e., using the controller as a monitoring device)

In a virtual networking context, OF can be used to program virtual switches with tenant level segregation tags (for example VLANs). In the context of NFV, OF can be used to re-direct traffic to a chain of services. It is managed by the Open Networking Foundation.

Why do we need OpenFlow?

Routers and switches can achieve various (limited) levels of user programmability. However, engineers and managers need more than the limited functionality of this hardware. OpenFlow achieves consistent traffic management and engineering exactly for these needs. This is achieved by controlling the functions independently of the hardware used.

PANTHEON.tech has managed to implement the OpenFlow plugin in lighty-core. Today, we will show you how you can run the plugin yourself.

Prerequisites

In order to build and install lighty-core artifacts locally, follow the procedure below:

  1. Install JDK – make sure JDK 8 is installed
  2. Install maven – make sure you have Maven 3.5.0 or later installed
  3. Setup maven – make sure you have proper settings.xml in your ~/.m2 directory
  4. Download/clone lighty-core
  5. (Optional) Download/clone the OpenFlow Manager App

Build and Run OpenFlow plugin example

1. Download the lighty-core repository:

git clone https://github.com/PANTHEONtechlighty-core.git

2. Checkout lighty-core version 9.2.x:

git checkout 9.2.x

3. Build the lighty-core project with the maven command:

mvn clean install

This will download all important dependencies and create .zip archive in ‘lighty-examples/lighty-community-restconf-ofp-app’ directory.

Extract this archive and start ‘start-ofp.sh’ script or run .jar file using Java 8 with the command:

java -jar lighty-community-restconf-ofp-app-9.2.1-SNAPSHOT.jar

Use custom config files

The previous command will run the application with default configuration. In order to run it with a custom configuration, edit (or create new) JSON configuration file. Example of JSON configuration can be found in lighty-community-restconf-ofp-app-9.2.1-SNAPSHOT folder.

With the previous command to start the application, pass the path to the configuration file as an argument:

java -jar lighty-community-restconf-ofp-app-9.2.1-SNAPSHOT.jar sampleConfigSingleNode.json

OpenFlow plugin and RESTCONF Configuration

An important configuration, which decides what can be changed, is stored in sampleConfigSingleNode.json. For applying all changes, we need to start OFP with this configuration as a Java parameter.

ForwardingRulesManager

FLOWs can be added to OpenFlow Plugin (OFP) in two ways:

  • Sending FLOW to config data-store. ForwardingRulesManager (FRM) is listening to the config-data store. When it’s changed. the config data store FRM will sync changes on the connected device, once available.
    Flow added this way is persistent.
  • Sending a RPC message directly to device. This option works without FRM. When is device restarted, then this the configuration will disappear.

In case you need to disable FRM, start OFP with an external configuration & set the enableForwardingRulesManager to false. Then, simply start OFP with this external configuration.

RESTCONF

RESTCONF configuration can be changed in the JSON config file sampleConfigSingleNode.json, mentioned above. It is possible to change the RESTCONF port, IP address or version of RESTCONF. Currently, the version of RESTCONF set to DRAFT_18, but it can be set to DRAFT_02.

"restconf": {
    "httpPort": 8888,
    "restconfServletContextPath": "/restconf",
    "inetAddress": "0.0.0.0",
    "jsonRestconfServiceType": "DRAFT_18"
  },

How to start the OpenFlow example

Firstly, start the OpenFlow example application.

Make sure to read through this guide on how to install mininet.

Next step is to start mininet, with at least one Open vSwitch (use version 2.2.0 and higher).

sudo mn --controller=remote,ip=<IP_OF_RUNNING_LIGHTY> --topo=tree,1 --switch ovsk,protocols=OpenFlow13

For this explanation of OFP usage, RESTCONF is set to DRAFT_18. All RESTCONF calls used in this example can be imported from file OFP_postman_collection.json, in project resources to Postman.

We will quickly check if the controller is the owner of the connected device. If not, then the controller is not running or  the device is not properly connected:

curl --request GET \
  --url http://<IP_OF_RUNNING_LIGHTY>:8888/restconf/data/entity-owners:entity-owners \
  --header 'Authorization: Basic YWRtaW46YWRtaW4='

If you followed the instructions and there is a single controller running (not cluster) and only one device connected, the result is:

{
  "entity-owners": {
    "entity-type": [{
      "type": "org.opendaylight.mdsal.ServiceEntityType",
      "entity": [{
        "id": "/odl-general-entity:entity[name='openflow:1']",
        "candidate": [{
          "name": "member-1"
        }],
        "owner": "member-1"
      }]
    }, {
      "type": "org.opendaylight.mdsal.AsyncServiceCloseEntityType",
      "entity": [{
        "id": "/odl-general-entity:entity[name='openflow:1']",
        "candidate": [{
          "name": "member-1"
        }],
        "owner": "member-1"
      }]
    }]
  }
}

Let’s get information about the connected device. If you want to see all OFP inventory, use ‘get inventory‘ call from PostmanCollection.

From config:

curl -k --insecure --request GET \
  --url http:///<IP_OF_RUNNING_LIGHTY>:8888/restconf/data/opendaylight-inventory:nodes/node=openflow%3A1 \
  --header 'Authorization: Basic YWRtaW46YWRtaW4='

From operational:

curl -k --insecure --request GET \
  --url http:///<IP_OF_RUNNING_LIGHTY>:8888/restconf/data/opendaylight-inventory:nodes/node=openflow%3A1?content=nonconfig \
  --header 'Authorization: Basic YWRtaW46YWRtaW4='

JSON result starts with:

{
  "node": [{
    "id": "openflow:1",
    "node-connector": [{
      "id": "openflow:1:LOCAL",
      "flow-node-inventory:peer-features": "",
      "flow-node-inventory:advertised-features": "",
      "flow-node-inventory:port-number": 4294967294,
      "flow-node-inventory:hardware-address": "4a:15:31:79:7f:44",
      "flow-node-inventory:supported": "",
      "flow-node-inventory:current-speed": 0,
      "flow-node-inventory:current-feature": "",
      "flow-node-inventory:state": {
        "live": false,
        "link-down": true,
        "blocked": false
      },
      "flow-node-inventory:maximum-speed": 0,
      "flow-node-inventory:name": "s1",
      "flow-node-inventory:configuration": "PORT-DOWN"
    }, {
      "id": "openflow:1:2",
      "flow-node-inventory:peer-features": "",
      "flow-node-inventory:advertised-features": "",
      "flow-node-inventory:port-number": 2,
      "flow-node-inventory:hardware-address": "fa:c3:2c:97:9e:45",
      "flow-node-inventory:supported": "",
      "flow-node-inventory:current-speed": 10000000,
      "flow-node-inventory:current-feature": "ten-gb-fd copper",
      "flow-node-inventory:state": {
        "live": false,
        "link-down": false,
        "blocked": false
      },
      .
      .
      .

Add FLOW

Now try to add table-miss flow, which will modify the switch to send all not-matched-packets to the controller via packet-in messages.

To config data-store:

curl --request PUT \
  --url http://<IP_OF_RUNNING_LIGHTY>:8888/restconf/data/opendaylight-inventory:nodes/node=openflow%3A1/table=0/flow=1 \
  --header 'Authorization: Basic YWRtaW46YWRtaW4=' \
  --header 'Content-Type: application/xml' \
  --data '<?xml version="1.0" encoding="UTF-8" standalone="no"?>
<flow xmlns="urn:opendaylight:flow:inventory">
   <barrier>false</barrier>
   <cookie>54</cookie>
   <flags>SEND_FLOW_REM</flags>
   <flow-name>FooXf54</flow-name>
   <hard-timeout>0</hard-timeout>
   <id>1</id>
   <idle-timeout>0</idle-timeout>
   <installHw>false</installHw>
   <instructions>
       <instruction>
           <apply-actions>
               <action>
                   <output-action>
                       <max-length>65535</max-length>
                       <output-node-connector>CONTROLLER</output-node-connector>
                   </output-action>
                   <order>0</order>
               </action>
           </apply-actions>
           <order>0</order>
       </instruction>
   </instructions>
   <match/>
   <priority>0</priority>
   <strict>false</strict>
   <table_id>0</table_id>
</flow>'

Directly to a device via RPC call:

curl --request POST \
  --url http://<IP_OF_RUNNING_LIGHTY>:8888/restconf/operations/sal-flow:add-flow \
  --header 'Authorization: Basic YWRtaW46YWRtaW4=' \
  --header 'Content-Type: application/json' \
  --data '{
    "input": {
      "opendaylight-flow-service:node":"/opendaylight-inventory:nodes/opendaylight-inventory:node[opendaylight-inventory:id='\''openflow:1'\'']",
      "priority": 0,
      "table_id": 0,
      "instructions": {
        "instruction": [
          {
            "order": 0,
            "apply-actions": {
              "action": [
                {
                  "order": 0,
                  "output-action": {
                    "max-length": "65535",
                    "output-node-connector": "CONTROLLER"
                  }
                }
              ]
            }
          }
        ]
      },
      "match": {
      }
    }
}

Get FLOW

Check if flow is in data-store:

In the config:

curl --request GET \
  --url http://<IP_OF_RUNNING_LIGHTY>:8888/restconf/data/opendaylight-inventory:nodes/node=openflow%3A1/table=0 \
  --header 'Authorization: Basic YWRtaW46YWRtaW4='

In operational:

curl --request GET \
  --url http://<IP_OF_RUNNING_LIGHTY>:8888/restconf/data/opendaylight-inventory:nodes/node=openflow%3A1/table=0?content=nonconfig \
  --header 'Authorization: Basic YWRtaW46YWRtaW4='

Result:

{
    "flow-node-inventory:table": [
        {
            "id": 0,
            "opendaylight-flow-table-statistics:flow-table-statistics": {
                "active-flows": 1,
                "packets-looked-up": 14,
                "packets-matched": 4
            },
            "flow": [
                {
                    "id": "1",
                    "priority": 0,
                    "opendaylight-flow-statistics:flow-statistics": {
                        "packet-count": 4,
                        "byte-count": 280,
                        "duration": {
                            "nanosecond": 936000000,
                            "second": 22
                        }
                    },
                    "table_id": 0,
                    "cookie_mask": 0,
                    "hard-timeout": 0,
                    "match": {},
                    "cookie": 54,
                    "flags": "SEND_FLOW_REM",
                    "instructions": {
                        "instruction": [
                            {
                                "order": 0,
                                "apply-actions": {
                                    "action": [
                                        {
                                            "order": 0,
                                            "output-action": {
                                                "max-length": 65535,
                                                "output-node-connector": "CONTROLLER"
                                            }
                                        }
                                    ]
                                }
                            }
                        ]
                    },
                    "idle-timeout": 0
                }
            ]
        }
    ]
}

Get FLOW directly from modified device s1 in the command line:

sudo ovs-ofctl -O OpenFlow13 dump-flows s1

Device result:

cookie=0x36, duration=140.150s, table=0, n_packets=10, n_bytes=700, send_flow_rem priority=0 actions=CONTROLLER:65535

Update FLOW

This works the same as add flow. OFP will find openflow:1, table=0, flow=1 from url and update changes from the body.

Delete FLOW

From config data-store:

curl --request DELETE \
  --url http://<IP_OF_RUNNING_LIGHTY>:8888/restconf/data/opendaylight-inventory:nodes/node=openflow%3A1/table=0/flow=1 \
  --header 'Authorization: Basic YWRtaW46YWRtaW4=' \
  --header 'Content-Type: application/xml' \
  --data ''

Via RPC calls:

curl --request POST \
  --url http://<IP_OF_RUNNING_LIGHTY>:8888/restconf/operations/sal-flow:remove-flow \
  --header 'Authorization: Basic YWRtaW46YWRtaW4=' \
  --header 'Content-Type: application/json' \
  --data '{
    "input": {
      "opendaylight-flow-service:node":"/opendaylight-inventory:nodes/opendaylight-inventory:node[opendaylight-inventory:id='\''openflow:1'\'']",
      "table_id": 0
    }
}'

Proactive flow installation & traffic monitor via Packet-In messages

In order to create traffic, we need to setup topology behavior. There are three methods for flow table population (Reactive, Proactive, Hybrid). We encourage you to read more about their differences.

In our example, we use Proactive flow installation, which means that we proactively create flows before traffic started.

  1. Start lighty OpenFlow example lighty-community-restconf-ofp-app
  2. Create mininet with linear topology and 2 open vSwitches
sudo mn --controller=remote,ip=<IP_OF_RUNNING_LIGHTY>:6633 --topo=linear,2 --switch ovsk,protocols=OpenFlow13

Now we tested that connection between devices is not established:

mininet> pingall
*** Ping: testing ping reachability
h1 -> X
h2 -> X
*** Results: 100% dropped (0/2 received)

Next step is to create flows, that create a connection between switches. This will be managed by setting Matched and Action filed in Table 0. In this example, we connect two ports eth1 and eth2 in a switch together. So everything that comes from port eth1, is redirected to port eth2 and vice versa.

Next configuration will be sending monitoring packets in a network. This configuration has set the switch s1 to send all packets, which came to port eth2, to the controller. So the visualized result should look like this:

OpenFlow Proactive1

1. Add flow to switch s1 (named in OFP as ‘openflow:1’), which redirect all traffic that comes from port eth1 (in OFP named as ‘1’) to port eth2 (in OFP named as ‘2’).

curl --request PUT \
  --url http://<IP_OF_RUNNING_LIGHTY>:8888/restconf/data/opendaylight-inventory:nodes/node=openflow%3A1/table=0/flow=0 \
  --header 'Authorization: Basic YWRtaW46YWRtaW4=' \
  --header 'Content-Type: application/json' \
  --data '{
      "flow": [
          {
              "table_id": "0",
              "id": "0",
              "priority": "10",
              "match": {
                  "in-port": "openflow:1:1"
              },
              "instructions": {
                  "instruction": [
                      {
                          "order": 0,
                          "apply-actions": {
                              "action": [
                                  {
                                      "order": 0,
                                      "output-action": {
                                          "output-node-connector": "2",
                                          "max-length": "65535"
                                      }
                                  }
                              ]
                          }
                      }
                  ]
              }
          }
      ]
}'

2. Add flow to switch s1, which will connect port 2 and 1 in another direction. Set switch s1 to send all packet transmitted through port 2 to controller:

curl --request PUT \
  --url http://<IP_OF_RUNNING_LIGHTY>:8888/restconf/data/opendaylight-inventory:nodes/node=openflow%3A1/table=0/flow=1 \
  --header 'Authorization: Basic YWRtaW46YWRtaW4=' \
  --header 'Content-Type: application/json' \
  --data '{
    "flow": [
        {
            "table_id": "0",
            "id": "1",
            "priority": "10",
            "match": {
                "in-port": "openflow:1:2"
            },
            "instructions": {
                "instruction": [
                    {
                        "order": 0,
                        "apply-actions": {
                            "action": [
                                {
                                    "order": 0,
                                    "output-action": {
                                        "output-node-connector": "1",
                                        "max-length": "65535"
                                    }
                                },
                                {
                                    "order": 1,
                                    "output-action": {
                                        "output-node-connector": "CONTROLLER",
                                        "max-length": "65535"
                                    }
                                }
                            ]
                        }
                    }
                ]
            }
        }
    ]
}'

3. Check all added flows at s1 switch:

{
    "flow-node-inventory:table": [
        {
            "id": 0,
            "opendaylight-flow-table-statistics:flow-table-statistics": {
                "active-flows": 1,
                "packets-looked-up": 317,
                "packets-matched": 273
            },
            "flow": [
                {
                    "id": "1",
                    "priority": 10,
                    "opendaylight-flow-statistics:flow-statistics": {
                        "packet-count": 0,
                        "byte-count": 0,
                        "duration": {
                            "nanosecond": 230000000,
                            "second": 5
                        }
                    },
                    "table_id": 0,
                    "cookie_mask": 0,
                    "hard-timeout": 0,
                    "match": {
                        "in-port": "openflow:1:2"
                    },
                    "cookie": 0,
                    "flags": "",
                    "instructions": {
                        "instruction": [
                            {
                                "order": 0,
                                "apply-actions": {
                                    "action": [
                                        {
                                            "order": 0,
                                            "output-action": {
                                                "max-length": 65535,
                                                "output-node-connector": "1"
                                            }
                                        },
                                        {
                                            "order": 1,
                                            "output-action": {
                                                "max-length": 65535,
                                                "output-node-connector": "CONTROLLER"
                                            }
                                        }
                                    ]
                                }
                            }
                        ]
                    },
                    "idle-timeout": 0
                }
            ]
        }
    ]
}


4. Add flow to switch s2 to connect port 1 and 2:

curl --request PUT \
  --url http://<IP_OF_RUNNING_LIGHTY>:8888/restconf/data/opendaylight-inventory:nodes/node=openflow%3A2/table=0/flow=0 \
  --header 'Authorization: Basic YWRtaW46YWRtaW4=' \
  --header 'Content-Type: application/json' \
  --data '{
    "flow": [
        {
            "table_id": "0",
            "id": "0",
            "priority": "10",
            "match": {
                "in-port": "openflow:2:1"
            },
            "instructions": {
                "instruction": [
                    {
                        "order": 0,
                        "apply-actions": {
                            "action": [
                                {
                                    "order": 0,
                                    "output-action": {
                                        "output-node-connector": "2",
                                        "max-length": "65535"
                                    }
                                }
                            ]
                        }
                    }
                ]
            }
        }
    ]
}'

5. Check all added flow at s2 switch:

{
    "flow-node-inventory:table": [
        {
            "id": 0,
            "opendaylight-flow-table-statistics:flow-table-statistics": {
                "active-flows": 2,
                "packets-looked-up": 294,
                "packets-matched": 274
            },
            "flow": [
                {
                    "id": "0",
                    "priority": 10,
                    "opendaylight-flow-statistics:flow-statistics": {
                        "packet-count": 0,
                        "byte-count": 0,
                        "duration": {
                            "nanosecond": 388000000,
                            "second": 7
                        }
                    },
                    "table_id": 0,
                    "cookie_mask": 0,
                    "hard-timeout": 0,
                    "match": {
                        "in-port": "openflow:2:1"
                    },
                    "cookie": 0,
                    "flags": "",
                    "instructions": {
                        "instruction": [
                            {
                                "order": 0,
                                "apply-actions": {
                                    "action": [
                                        {
                                            "order": 0,
                                            "output-action": {
                                                "max-length": 65535,
                                                "output-node-connector": "2"
                                            }
                                        }
                                    ]
                                }
                            }
                        ]
                    },
                    "idle-timeout": 0
                },
                {
                    "id": "1",
                    "priority": 10,
                    "opendaylight-flow-statistics:flow-statistics": {
                        "packet-count": 0,
                        "byte-count": 0,
                        "duration": {
                            "nanosecond": 98000000,
                            "second": 3
                        }
                    },
                    "table_id": 0,
                    "cookie_mask": 0,
                    "hard-timeout": 0,
                    "match": {
                        "in-port": "openflow:2:2"
                    },
                    "cookie": 0,
                    "flags": "",
                    "instructions": {
                        "instruction": [
                            {
                                "order": 0,
                                "apply-actions": {
                                    "action": [
                                        {
                                            "order": 0,
                                            "output-action": {
                                                "max-length": 65535,
                                                "output-node-connector": "1"
                                            }
                                        }
                                    ]
                                }
                            }
                        ]
                    },
                    "idle-timeout": 0
                }
            ]
        }
    ]
}

Now, when we try to ping all devices in mininet, we will receive positive feedback:

mininet> pingall
*** Ping: testing ping reachability
h1 -> h2
h2 -> h1
*** Results: 0% dropped (2/2 received)

Show Packet-In messages with Wireshark

Wireshark is a popular network protocol analyzer. It lets you analyze everything that is happening in your network and is a necessity for network administrators and power-users alike.

Start Wireshark with the command:

sudo wireshark

After it starts, double click on ‘any’ filter. Then, filter packets with ‘openflow_v4.type == 10‘. Now, the Wireshark environment setup will only show Packet-In messages from OpenFlow protocol.

To create traffic in mininet network, we used mininet command:

h2 ping h1

If everything is setup correctly, then we can see Packet-In messages showing up.

Show Packet-In messages with PacketInListener

In the below section for Java developers, there is an option for setting Packet-In Listener. This configuration set to log every Packet-In message as a TRACE log to console. When this is done, run mininet command ‘h2 ping h1’ again.

If everything is set up correctly, then we can see Packet-In messages in logs.

Java DevelopersSome configuration can be done in Java Main class from OpenFlow Protocol example.

Packet-in listener

Packet handling is managed by adding a Packet Listener. In our example, we add the PacketInListener class, which will be logging packet-in messages. For a new packet listener class, it is important to have implemented the class “PacketProcessingListener”.

The first step is to create an instance of PacketInListener (1 – in the window below). Then we will add OpenflowSouthboundPluginBuilder to this part of the code (2 – in the window below).

//3. start openflow SBP
     PacketProcessingListener packetInListener = new PacketInListener();           (1)
     final OpenflowSouthboundPlugin plugin;
     plugin = new OpenflowSouthboundPluginBuilder()
             .from(configuration, lightyController.getServices())
             .withPacketListener(packetInListener)                                 (2)
             .build();
     ListenableFuture<Boolean> start = plugin.start();

OpenFlow Manager (OFM) App

OpenFlow Manager (OFM) is an application developed to run on top of ODL/Lighty to visualize OpenFlow (OF) topologies, program OF paths, gather OF stats and for managing flow tables. In order to install the OFM App, follow these steps:

1. Download OFM repositories from GitHub and checkout master branch

git clone https://github.com/PANTHEONtechOpenDaylight-Openflow-App.git
git checkout master

2. NGINX installation

NGINX is used to serve as a proxy server towards OFM application and ODL/lighty RESTCONF interface. Before NGINX starts, it is important to the switch NGINX config file in /etc/nginx/sites-enabled/ with the default file in the root of this project.

In this default file, we have set up the NGINX port, port for RESTCONF and Grunt port. Please be sure that these ports are correct.

After replacing the config file, start NGINX with the command:

sudo apt install nginx

If  you need to stop NGINX, type in the command:

sudo systemctl stop nginx

3. OFM configuration
Before running the OFM standalone application, it is important to configure:

  • The controller base URL
  • NGINX port
  • ODL username and ODL/lighty password

All this information should be written in env.module.js file located in the directory ofm src/common/config.

4. Grunt installation
To run OFM standalone app on local web server, you can use tool Grunt. For this tool is everything prepared in the OFM repository. Grunt is installable via npm, the Node.js package manager.After running grunt and NGINX you can access OFM standalone app via web browser on used NGINX port typing URL localhost:9000.

After running Grunt and NGINX, you can access OFM standalone app via a web browser on a used NGINX port by typing the URL localhost:9000.

OpenFlow Manager environment

With OFM, we can also start the Lighty-OpenFlow Southbound plugin example. From lighty-core repository, follow the example above. In this example, we will use mininet to simulate network topology, start with the command:

sudo mn --controller=remote,ip=<IP_OF_RUNNING_LIGHTY>:6633 --topo=linear,2 --switch ovsk,protocols=OpenFlow13

If everything is set up correctly, then you should see a basic view of the network topology:

BasicView

Device management

To see detailed device information, select those devices that you want to inspect. Then click on the main menu bar, at the top of “Flow management” section. Now, you should see device information and added Flows.

In a Flow section, you can Add Flow by clicking on the pen on the left-top side of the table marked by an arrow. In the right side of table at each row, you can delete or update selected flow.

FlowManagment

Adding Flows

Adding a flow can be done from the Flow management section by clicking on the pen, on the left-top side of Flow table. Here you can choose the switch, from where the flow should be sent. Then just click on the property that should be added in the flow, from the left menu.

After filling all required fields, you can view your flow as a JSON message, by clicking on the “show preview” button. For sending flows to a switch, click on “Send message” button.

Create TableMiss Flow 1

Statistics

To show statistics in the network click on the “Statistics” section in the main menu bar.  Then, choose from the drop-down menu what statistic you want to see and click on “Refresh data” button.

Statistics

Conclusion

We have managed to integrate the whole OpenFlow plugin into lighty-core. This is the same way it is implemented in OpenDaylight, version Fluorine (SR1). It is, therefore, possible to use lighty-controller for managing network devices via the OpenFlow protocol.

If you would like to see how our commercial version might benefit your business, please visit lighty.io for more information, or contact us here.

20190225 162116

PANTHEON.tech @ MWC 2019 in Barcelona

March 5, 2019/in Blog /by PANTHEON.tech

PANTHEON.tech‘s Denis Rasulev visited Barcelona for the annual Mobile World Conference in Barcelona. Here are his thoughts on the event.

I was thrilled to visit MWC from the beginning. Such a huge and renowned event always shows the latest tech not only in the mobile sector. This years themes and keywords could be summarized to three cores: 5G, IoT & AI.

First of all, I would like to point out how well the event was organized. I was greeted with my badge right at the airport, with directions towards the conference being provided by helpful volunteers. After settling in Barcelona, I set off to start my day early and arrive at the MWC at 8 AM.

I soon regretted being an early bird, since most booths were closed at this time and most presenters were just settling in. The Fira Gran Via, designed by Japanese architect Toyo Ito, was monumental and emphasized the futuristic approach of the conference. Saying the venue was monumental is an understatement – I was only able to visit 2/3 of all booths on the first day. In total,

I have made 89,109 steps throughout MWC 2019.

Themes @ MWC 2019

Some booths were both impressive and beautiful, either taking up several hundred square-meters of space. Some booths even had two floors, just to underline the massiveness of the event. The venue was packed with attendees since morning, but it was easy to talk to presenters and orientate in each pavilion.

20190225 161318
20190225 161318
20190225 131059
20190225 131059
20190225 125313
20190225 125313
20190225 121414
20190225 121414

With each day and conference, we can feel that 5G is coming closer to consumers and real-life deployment. What seemed like a wild, unreal idea a few years ago is now on the way of dictating the future of each new technology. I saw remote road assistance which was possible due to lightning-fast 5G utilization. Healthcare could become fully automated or remotely controlled. Again, this is due to 5G coverage.

I am glad, that PANTHEON.tech is making sure to stay on point of this revolution and keep up.

The future of our industry

There were prototypes of robots, which would make coffee shops with humans obsolete. It would take your order via voice recognition and prepare your order. Another robot has perfectly built paper-planes with inhumane precision. Some of these products seemed like a toy for playing around. But we have to remember that this is what makes greatness – testing, thinking out-of-the-box and creating a functional concept. It was wonderful to see, that startups had an opportunity to also present themselves. Not only to attendees, but to potential investors as well.

20190226 120019
20190226 120019
20190225 123720
20190225 123720
20190225 120343
20190225 120343
20190225 110032
20190225 110032

I held the future in my hands, in form of the Barefoot Networks’ Toffino 2 chip. I was able to see the first functional, foldable phone by Samsung. But most importantly, I was able to see how the future will be shaped in the coming years.

MWC is a must-go, powerful event with great networking opportunities. Trust me, you want to be there. In the future, I will definitely require a larger team to cover more ground at the next Mobile World Conference. Hopefully, PANTHEON.tech will see you there!

VPP 105: Memory Management & DPDK APIs

Vector Packet Processing 104: gRPC & REST

February 13, 2019/in Blog, VPP /by PANTHEON.tech

Welcome back to our Vector Packet Processing implementation guide, Part 4.

Today, we will go through the essentials of gRPC and REST and introduce their core concepts, while introducing one missing functionality into our VPP build. This part will also introduce the open-source GoVPP, Go language bindings for binary API – VPP management.

The Issue

Natively, VPP does not include a gRPC / RESTful interface. PANTHEON.tech has developed an internal solution, which utilizes a gRPC-gateway to VPP, using GoVPP. It is called VPP-RPC, through which you can now connect to VPP using a REST client. 

CONTACT US FOR A CUSTOM INTEGRATION

In case you are interested in this solution, please contact us via our website.


Introduction

First and foremost, here are the terms that you will come across in this guide:

  • gRPC (Remote Procedure Calls) is a remote procedure call (RPC) system initially developed by Google. It uses HTTP/2 for transport, protocol buffers as the interface description language, and provides features such as authentication, bidirectional streaming and flow control, blocking or non-blocking bindings, and cancellation and timeouts. It generates cross-platform client and server bindings for many programming-languages.
  • gRPC-gateway (GRPC-GW) is a plugin of protobuf. It reads the gRPC service definition and generates a reverse-proxy server which translates a RESTful JSON API into gRPC. This server is generated according to custom options in your gRPC definition.
  • VPP-Agent is aset of VPP-specific plugins that interact with Ligato, in order to access services within the same cloud. VPP Agent provides VPP functionality to client apps through a VPP model-driven API
  • VPP-RPC is our new RESTful VPP service. It utilizes gRPC & gRPC-gateway as 2 separate processes, in order to facilitate communication with VPP through GoVPP.

JSON message sequence

gRPC gateway exposes the REST service, for which there is no built-in support in VPP. By using gRPC-gateway and gRPC server services, the VPP API is available through gRPC and REST at the same time. Both services use generated models from VPP binary APIs, therefore exposing both APIs is easy enough to include both. It is up to the user to choose, which mechanism they will use.

When exchanging data between a browser and a server, the data can only be text. Any JavaScript object can be converted into a JSON and sent to the server. This allows us to process data as JavaScript objects, while avoiding complicated translations and parsing issues.

The sequence diagram below describes the path the original JSON message takes in our solution:

  1. The Client sends a HTTP request to GRPC-GW
  2. GRPC-GW transforms the JSON into protobuf message & sends it to the gRPC server
  3. Each RPC has a go method handling its logic. For unary RPCs, this simply means copying the protobuf message into the corresponding VPP message structure and passing it to GoVPP binary API
  4. GoVPP eventually passes the message to the underlying VPP binary API, where the desired functionality is executed

VPP API build process

The figure below describes the build process for a single VPP API. Lets see what needs to happen for a tap API:

schema februar1

Build process for a VPP API. @PANTHEON.tech

VPP APIs are defined in /usr/share/VPP/api/ which is accessible after installing VPP. The Go package tap is a generated via the VPP Agent binary API of the ‘tap’ VPP module. It is generated from this file: tap.api.json.

This file will drive the creation of all 3 building blocks:

  • GoVPP’s binapi-generator generates the GoVPP file tap.ba.go
  • vpp-rpc-protogen generates tap.proto, which contains the gRPC messages and services, including the URL for each RPC
  • protoc’s go plugin will compile the proto file and create a gRPC stub tap.pb.go, containing client & server interfaces that define RPC methods and protobuf message structs.
  • Vpp-rpc-implementor will generate the code that implements the TapServer interface – the actual RPC methods calling GoVPP APIs – in Tap.server.go file.
  • protoc’s gRPC-gateway plugin will compile the proto file and create the reverse proxy tap.pb.gw.go. We don’t have to touch this file further.

Running the examples

To run all the above, we need to make sure all these processes are running:

  • VPP service
  • gRPC server (needs root privileges)

    sudo vpp-rpc-server
  • gRPC gateway

    vpp-rpc-gateway

Running a simple request using Curl

If we want to invoke the API we have created, we can use Curl. Vpe will require an URL (vpe/showversion/request), which will map the above mentioned API to VPP’s binary API. We will now use Curl to POST a request to a default address of localhost:8080:

curl -H "Content-Type: application/json" -X POST 127.0.0.1:8080/Vpe/ShowVersion/request --silent

{"Retval":0,"Program":"dnBlAAAAAAAAAAAAAAAAAAAAAAAAAAAAAAAAAAAAAAA=","Version":"MTguMDctcmMwfjEyOC1nNmYxYzQ4ZAAAAAAAAAAAAAA=",
"BuildDate":"xaB0IG3DoWogIDMgMTQ6MTA6NTQgQ0VTVCAyMDE4AAA=",
"BuildDirectory":"L2hvbWUvcGFsby92cHA"}

The decoded reply says:

{
    "Retval": 0,
    "Program": "vpe",
    "Version": "18.07-rc0~128-g6f1c48d",
    "BuildDate": "Thu May  3 14:10:54 CEST 2018",
    "BuildDirectory": "/home/user/vpp"
}

Postman collection

We provide a Postman collection within our service, which serves as a starting point for users with our solution. The collection created in the vpp-rpc repository, tests/vpp-rpc.postman_collection.json path, contains various requests and subsequent tests to the Tap module.

Performance analysis in Curl

Curl can give us detailed timing analysis of a request’s performance. If we run the previous request 100 times, the summary times (in milliseconds) we get usually are:

mean=4.82364000000000000
min=1.047
max=23.070
average rr per_sec=207.31232015656226418223
average rr per_min=12438.73920939373585093414
average rr per_hour=746324.35256362415105604895

Judging from the graph below, we see that most of the requests take well below the average mark. Profiling our solution, we’ve found the reason for the anomalies (above 10ms) to be caused by GoVPP itself when waiting on the reply from VPP. This behavior is well documented on GoVPP wiki. We can conclude our solution closely mirrors the performance  of the synchronous GoVPP APIs.

Here is the unary RPC total time in ms:


GoVPP RPC total

In conclusion, we have introduced ourselves to the concepts of gRPC and have run our VPP API + GoVPP build, with a REST service feature. Furthermore, we have shown you our in-house solution VPP-RPC, which facilitates the connection between the API and GoVPP.

If you would like to inquire about this solution, please contact us for more information.

In the last part of this series, we will take a closer look at the gNMI service and how we can benefit from it.


You can contact us at https://pantheon.tech/

Explore our Pantheon GitHub.

Watch our YouTube Channel.
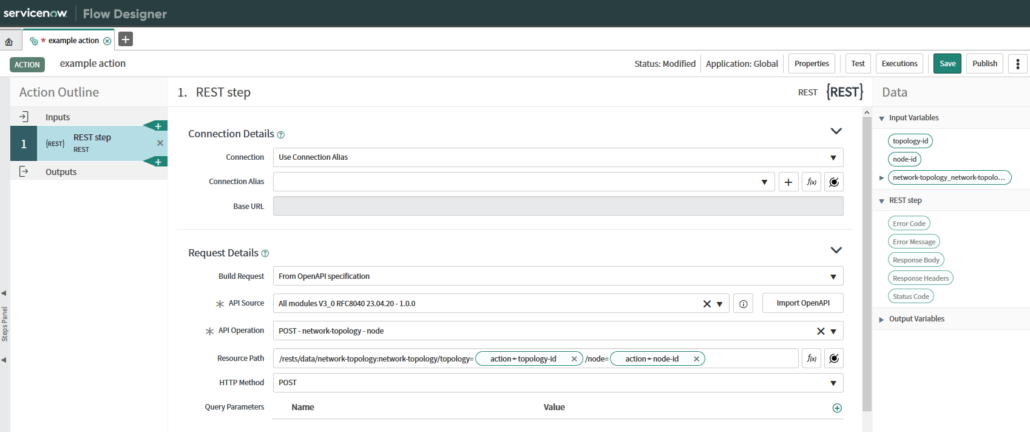
ligato

Vector Packet Processing 103: Ligato & VPP Agent

February 6, 2019/in Blog, VPP /by PANTHEON.tech

Welcome back to our guide on Vector Packet Processing. In today’s post number three from our VPP series, we will take a look at Ligato and its VPP Agent.

CONTACT US FOR A CUSTOM INTEGRATION

Ligato is one of the multiple commercially supported technologies supported by PANTHEON.tech.

What is a VNF?

A Virtual Network Function is a software implementation of a function. It runs on single or multiple Virtual Machines or Containers, on top of a hardware networking infrastructure. Individual functions of this network may be implemented or combined together, in order to create a complete networking communication service. A VNF can be used as a standalone entity or part of an SDN architecture.

Its life-cycle is controlled by orchestration systems, such as the increasingly popular Kubernetes. Cloud-native VNFs and their control/management plane can expose REST or gRPC APIs to external clients, communicate over a message bus, or provide a cloud-friendly environment for deployment and usage. It can also support high-performance data planes, such as VPP.

What is Ligato?

It is the open-source cloud platform for building and wiring VNFs. Ligato provides infrastructure and libraries, code samples, and CI/CD processes to accelerate and improve the overall developer experience. It paves the way towards faster code reuse, reducing costs, and increasing application agility & maintainability. Being native to the cloud, Ligato has a minimal footprint, plus can be easily integrated, customized, and extended, deployed using Kubernetes. The three main components of Ligato are:

  • CN Infra – a Golang platform for developing cloud-native microservices. It can be used to develop any microservice, even though it was primarily designed for Virtual Network Function management/control plane agents.
  • SFC Controller – an orchestration module for data-plane connectivity within cloud-native containers. These containers may be VPP-Agent enabled or communicate via veth interfaces.
  • BGP Agent – a Border Gateway Protocol information provider. You can also view a Ligato demonstration done by PANTHEON.tech here.

The platform is modular-based – new plugins provide new functionality. These plugins can be set up in layers, where each layer can form a new platform with different services at a higher layer plane. This approach mainly aims to create a management/control plane for VPP, with the addition of the VPP Agent.

What is the VPP Agent?

The VPP Agent is a set of VPP-specific plugins that interact with Ligato, in order to access services within the same cloud. VPP Agent provides VPP functionality to client apps through a VPP model-driven API. External and internal clients can access this API, if they are running on the same CN-Infra platform, within the same Linux process. 

Quick starting the VPP Agent

  • Pull the latest image from Docker, which includes VPP + VPP Agent
    • Or clone the repository from Ligato GitHub
  • Install Kafka
  • Install ETCD

For this example, we will work with the pre-built Docker image.

Install & Run

  1. Run the downloaded Docker image:

    docker pull ligato/vpp-agent
    docker run -it --name vpp --rm ligato/vpp-agent
  2. Using agentctl, configure the VPP Agent:

    docker exec -it vpp agentctl -
  3. Check the configuration, using agentctl or the VPP console:

    docker exec -it vpp agentctl -e 172.17.0.1:2379 show
    docker exec -it vpp vppctl -s localhost:500

For a detailed rundown of the Quickstart, please refer to the Quickstart section of VPP Agents Github.

We have shown you how to integrate and quickstart the  VPP Agent, on top of Ligato.

Our next post will highlight gRPC/REST – until then, enjoy playing around with VPP Agent.


You can contact us at https://pantheon.tech/

Explore our Pantheon GitHub.

Watch our YouTube Channel.
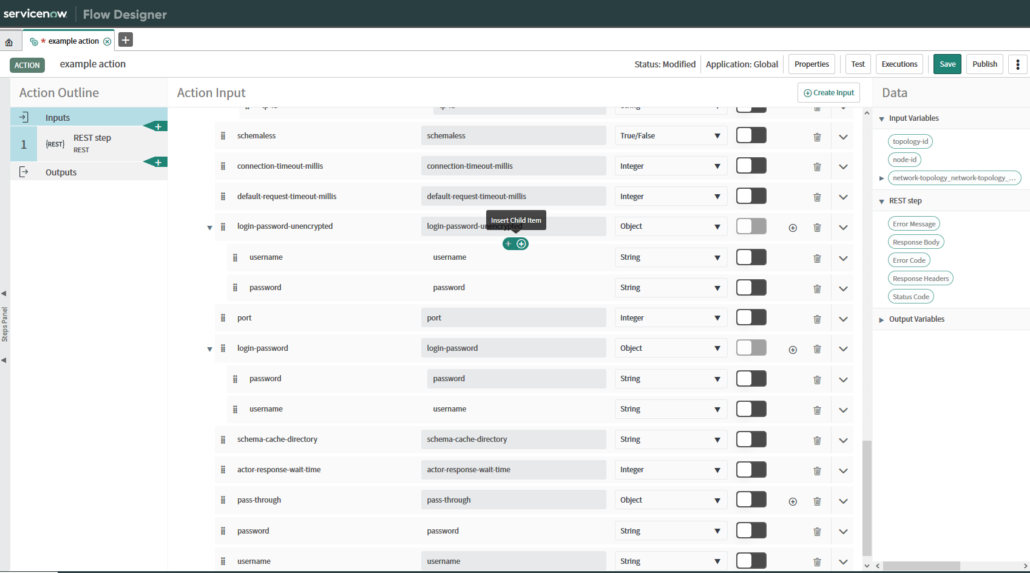
Vector Packet Processing 102: Honeycomb & hc2vpp

Vector Packet Processing 102: Honeycomb & hc2vpp

January 21, 2019/in Blog, VPP /by PANTHEON.tech
Welcome to the second part of our VPP Introduction series, where we will talk about details of the Honeycomb project. Please visit our previous post on VPP Plugins & Binary API, which is used in Honeycomb to manage the VPP agent.

What is Honeycomb?

Honeycomb is a generic, data plane management agent and provides a framework for building specialized agents. It exposes NETCONF, RESTCONF and BGP as northbound interfaces.

Honeycomb runs several, highly functional sets of APIs, based in ODL, which are used to program the VPP platform. It leverages ODL’s existing tools and integrates several of its existing components (YANG Tools, MD-SAL, NETCONF/RESTCONF…).  In other words – it is a light on resources, bare bone version of OpenDaylight.

CONTACT US FOR A CUSTOM INTEGRATION

Its translation layer and data processing pipelines are classified as generic, which makes it extensible and usable not only as a VPP specific agent.

Honeycomb’s functionality can be split into two main layers:

  • Data Processing layer – pipeline processing for data from Northbound interfaces, towards the Translation layer
  • Translation layer – handles mainly configuration updates from data processing layer + reads and writes configuration-data
  • Plugins – extend Honeycombs usability

Honeycomb mainly acts as a bridge between VPP and the actual OpenDaylight SDN Controller.

Examples of VPP x Honeycomb integrations

We’ve already showcased several use cases on our Pantheon Technologies’ YouTube channel:

  • BGP in Honeycomb controlling the VPP FIB table
  • Honeycomb BGP-LS based on VPP IPv6
  • RESTCONF configuration of VPP as an IPsec endpoint
  • VxLAN for Linux Containers with VPP and Honeycomb
  • Containers integration with VPP and Honeycomb

For the purpose of integrating VPP with Honeycomb, we will further refer to the project hc2vpp, which was directly developed for VPP usage.

What is hc2vpp?

This VPP specific build is called hc2vpp, which provides an interface (somewhere between a GUI and a CLI) for VPP. It runs on the same host as the VPP instance and allows to manage it off-the-box. This project is lead by Pantheons own Michal Čmarada.

Honeycomb was created due to a need for configuring VPP via NETCONF/RESTCONF. During the time it was created, NETCONF/RESTCONF was provided by ODL. Therefore, Honeycomb is based on certain ODL tools (data-store, YANG Tools, others). ODL as such uses an enormous variety of tools. Honeycomb was created as a separate project, in order to create a smaller footprint. After its implementation, it exists as a separate server and starts these implementations from ODL.

Later on, it was decided that Honeycomb should be split into a core instance, and hc2vpp would handle VPP related parts. The split also occurred, in order to provide the possibility of creating a proprietary device control agent. hc2vpp (Honeycomb to VPP) is a configuration agent, so that configurations can be sent via NETCONF/RESTCONF. It translates the configuration to low level APIs (called Binary APIs).

Honeycomb and hc2vpp can be installed in the same way as VPP, by downloading the repositories from GitHub. You can either:

Install Honeycomb

  • Install Honeycomb via binary packages
  • Download the Honeycomb repository from FD.io’s GitHub

Install hc2vpp

  • Manually build a hc2vpp project
  • Download the hc2vpp repository from FDio’s GitHub

For more information, please refer to the hc2vpp official project site.

In the upcoming post, we will introduce you to the Ligato VPP Agent.


You can contact us at https://pantheon.tech/

Explore our Pantheon GitHub.

Watch our YouTube Channel.

Vector Packet Processing 101: VPP Plugins & Binary API

Vector Packet Processing 101: VPP Plugins & Binary API

January 10, 2019/in Blog, VPP /by PANTHEON.tech

In the first part of our new series, we will be building our first VPP platform plug-in, using basic examples. We will start with a first-dive into plugin creation and finish with introducing VAPI into this configuration.

CONTACT US FOR A CUSTOM INTEGRATION

If you do not know what VPP is, please visit our introductory post regarding VPP and why you should consider using it.

Table of contents:

  • How to write a new VPP Plugin
    • 1. Preparing your new VPP plugin
    • 2. Building & running your new plugin
  • How to create new API messages
  • How to call the binary API
    • Additional C/C++ Examples

How to write a new VPP Plugin

The principle of VPP is, that you can plug in a new graph node, adapt it to your network purposes and run it right off the bat. Including a new plugin does not mean, you need to change your core-code with each new addition. Plugins can be either included in the processing graph, or they can be built outside the source tree and become an individual component in your build.

Furthermore, this separation of plugins makes crashes a matter of a simple process restart, which does not require your whole build to be restarted because of one plugin failure.

1. Preparing your new VPP plugin

The easiest way how to create a new plugin that integrates with VPP is to reuse the sample code at “src/examples/sample-plugin”. The sample code implements a trivial “macswap” algorithm that demonstrates the plugins run-time integration with the VPP graph hierarchy, API and CLI.

  • To create a new plugin based on the sample plugin, copy and rename the sample plugin directory

cp -r src/examples/sample-plugin/sample src/plugins/newplugin

#replace 'sample' with 'newplugin'. as always, take extra care with sed!
cd src/plugins/newplugin
fgrep -il "SAMPLE" * | xargs sed -i.bak 's/SAMPLE/NEWPLUGIN/g'
fgrep -il "sample" * | xargs sed -i.bak 's/sample/newplugin/g'
rm *.bak*
rename 's/sample/newplugin/g' *

There are the are following files:

    • node.c – implements functionality of this graph node (swap source and destination address) -update according to your requirements.
    • newplugin.api – defines plugin’s API, see below
    • newplugin.c, newplugin_test.c – implements plugin functionality, API handlers, etc.
  • Update CMakeLists.txt in newplugin directory to reflect your requirements:
add_vpp_plugin(newplugin
  SOURCES
  node.c
  newplugin.c

  MULTIARCH_SOURCES
  node.c

  API_FILES
  newplugin.api

  API_TEST_SOURCES
  newplugin_test.c

  COMPONENT vpp-plugin-newplugin
)
  • Update sample.c to hook your plugin into the VPP graph properly:
VNET_FEATURE_INIT (newplugin, static) = 
{
 .arc_name = "device-input",
 .node_name = "newplugin",
 .runs_before = VNET_FEATURES ("ethernet-input"),
};
  • Update newplugin.api to define your API requests/replies. For more details see “API message creation” below.
  • Update node.c to do required actions on input frames, such as handling incoming packets and more

2. Building & running your new plugin

  • Build vpp and your plugin. New plugins will be built and integrated automatically, based on the CMakeLists.txt
make rebuild
  • (Optional) Build & install vpp packages for your platform
make pkg-deb
cd build-root
sudo dpkg -i *.deb
  • The binary-api header files you can include later are located in build-root/build-vpp_debug-native/vpp/vpp-api/vapi
    •  If vpp is installed, they are located in /usr/include/vapi
  • Run vpp and check whether your plugin is loaded (newplugin has to be loaded and listed using the show plugin CLI command)
make run
...
load_one_plugin:189: Loaded plugin: nat_plugin.so (Network Address Translation)
load_one_plugin:189: Loaded plugin: newplugin_plugin.so (Sample VPP Plugin)
load_one_plugin:189: Loaded plugin: nsim_plugin.so (network delay simulator plugin)
...
DBGvpp# show plugins
...
 Plugin Version Description
 1. ioam_plugin.so 19.01-rc0~144-g0c2319f Inbound OAM
 ...
 x. newplugin_plugin.so 1.0 Sample VPP Plugin
 ...

How to create new API messages

API messages are defined in *.api files – see src/vnet/devices/af_packet.api, src/vnet/ip/ip.api, etc. These API files are used to generate corresponding message handlers. There are two types of API messages – non-blocking and blocking. These messages are used to communicate with the VPP Engine to configure and modify data path processing.

Non-blocking messages use one request and one reply message. Message replies can be auto-generated, or defined manually. Each request contains two mandatory fields – “client-index” and “context“, and each reply message contains mandatory fields – “context” and “retval“.

  • API message with auto-generated reply

autoreply define ip_table_add_del
{
 u32 client_index;
 u32 context;
 u32 table_id;
...
};
  • API message with manually defined reply
define ip_neighbor_add_del
{
 u32 client_index;
 u32 context;
 u32 sw_if_index;
...
};
define ip_neighbor_add_del_reply
{
 u32 context;
 i32 retval;
 u32 stats_index;
...
};

Blocking messages use one request and series of replies defined in *.api file. Each request contains two mandatory fields – “client-index” and “context“, and each reply message contains mandatory field – “context“.

  • Blocking message is defined using two structs – *-dump and *_details

define ip_fib_dump
{
 u32 client_index;
 u32 context;
...
};
define ip_fib_details
{
 u32 context;
...
};

Once you define a message in an API file, you have to define and implement the corresponding handlers for given request/reply message. These handlers are defined in one of component/plugin file and they use predefined naming – vl_api_…_t_handler – for each API message.

Here is an example for existing API messages (you can check it in src/vnet/ip component):

#define foreach_ip_api_msg \
_(IP_FIB_DUMP, ip_fib_dump) \
_(IP_NEIGHBOR_ADD_DEL, ip_neighbor_add_del) \
...
static void vl_api_ip_neighbor_add_del_t_handler (vl_api_ip_neighbor_add_del_t * mp, vlib_main_t * vm)
{
...
 REPLY_MACRO2 (VL_API_IP_NEIGHBOR_ADD_DEL_REPLY,
...
static void vl_api_ip_fib_dump_t_handler (vl_api_ip_fib_dump_t * mp)
{
...
 send_ip_fib_details (am, reg, fib_table, pfx, api_rpaths, mp->context);
...

Request and reply handlers are usually defined in api_format.c (or in plugin). Request uses a predefined naming – api_… for each API message and you have to also define help for each API message :

static int api_ip_neighbor_add_del (vat_main_t * vam)
{
...
  /* Construct the API message */
  M (IP_NEIGHBOR_ADD_DEL, mp);
  /* send it... */
  S (mp);
  /* Wait for a reply, return good/bad news */
  W (ret);
  return ret;
}
static int api_ip_fib_dump (vat_main_t * vam)
{
...
  M (IP_FIB_DUMP, mp);
  S (mp);
  /* Use a control ping for synchronization */
  MPING (CONTROL_PING, mp_ping);
  S (mp_ping);
  W (ret);
  return ret;
}
#define foreach_vpe_api_msg \
...
_(ip_neighbor_add_del, \
 "(<intfc> | sw_if_index <id>) dst <ip46-address> " \
 "[mac <mac-addr>] [vrf <vrf-id>] [is_static] [del]") \
...
_(ip_fib_dump, "") \
...

Replies can be auto-generated or manually defined.

  • auto-generated reply using define foreach_standard_reply_retval_handler, with predefined naming
  • manually defined reply with details

How to call the binary API

In order to call the binary API, we will introduce VAPI to our configuration.

VAPI is the high-level C/C++ binary API. Please refer to src/vpp-api/vapi/vapi_doc.md for details.

VAPI’s multitude of advantages include:

  • All headers in a single place – /usr/include/vapi => simplifies code generation
  • Hidden internals – one no longer has to care about message IDs, byte-order conversion
  • Easier binapi calls – passing user provided context between callbacks

We can use the following C++ code to call our new plugins’s binary API.

#include <cstdlib>
#include <iostream>
#include <cassert>

//necessary includes & macros
#include <vapi/vapi.hpp>
#include <vapi/vpe.api.vapi.hpp>
DEFINE_VAPI_MSG_IDS_VPE_API_JSON

//include the desired modules / plugins
#include <vapi/newplugin.api.vapi.hpp>
DEFINE_VAPI_MSG_IDS_NEWPLUGIN_API_JSON

using namespace vapi;
using namespace std;

//parameters for connecting
static const char *app_name = "test_client";
static const char *api_prefix = nullptr;
static const int max_outstanding_requests = 32;
static const int response_queue_size = 32;

#define WAIT_FOR_RESPONSE(param, ret)      \
  do                                       \
    {                                      \
      ret = con.wait_for_response (param); \
    }                                      \
  while (ret == VAPI_EAGAIN)

//global connection object
Connection con;

void die(int exit_code)
{
    //disconnect & cleanup
    vapi_error_e rv = con.disconnect();
    if (VAPI_OK != rv) {
        fprintf(stderr, "error: (rc:%d)", rv);
    }

    exit(exit_code);
}

int main()
{
    //connect to VPP
    vapi_error_e rv = con.connect(app_name, api_prefix, max_outstanding_requests, response_queue_size);

    if (VAPI_OK != rv) {
        cerr << "error: connecting to vlib";
        return rv;
    }

    try
    {
        Newplugin_macswap_enable_disable cl(con);

        auto &mp = cl.get_request().get_payload();

        mp.enable_disable = true;
        mp.sw_if_index = 5;

        auto rv = cl.execute ();
        if (VAPI_OK != rv) {
            throw exception{};
        }

        WAIT_FOR_RESPONSE (cl, rv);
        if (VAPI_OK != rv) {
            throw exception{};
        }

        //verify the reply
        auto &rp = cl.get_response ().get_payload ();
        if (rp.retval != 0) {
            throw exception{};
        }
    }
    catch (...)
    {
        cerr << "Newplugin_macswap_enable_disable ERROR" << endl;
        die(1);
    }

    die(0);
}

Additional C/C++ Examples

Furthermore, you are encouraged to try the minimal VAPI example provided in vapi_minimal.zip below.

Download VAPI_Minimal.zip

Download VAPI_Minimal.zip

Send download link to:

I confirm that I have read and agree to the Privacy Policy.

Subscribe to our monthly flash-news! I have read and agree to the Privacy Policy.

This example creates a loopback interface, assigns it an IPv4 address and then prints the address.

Follow these steps:

  • Install VPP
  • Extract the archive, build & run examples
unzip vapi_minimal.zip
mkdir build; cd build
cmake ..
make

#c example
sudo ./vapi_minimal
#c++ example
sudo ./vapi_minimal_cpp

In conclusion, we have:

  • successfully built and ran our first VPP plugin
  • created and called an API message in VPP

Our next post will introduce and highlight the key reasons, why you should consider Honeycomb/hc2vpp in your VPP build.


You can contact us at https://pantheon.tech/

Explore our Pantheon GitHub. Follow us on Twitter.

Watch our YouTube Channel.

IMG 2578

PANTHEON.tech @ 2020 Vision Executive Summit in Lisbon

December 13, 2018/in Blog /by PANTHEON.tech

I was sent to Lisbon by PANTHEON.tech, in order to attend the annual 2020 Vision Executive Summit. Here are my experiences and insights into this event.

The 2020 Vision Executive Summit, presented by Light Reading, was focused mainly on the pending revolution of 5G networks, automation, Edge Computing, IoT, security, etc. It hosts a variety of vendors and service providers, who provide insights into the telecom industry’s current trends and emerging topics.

IMG 2572 e1544703408851
IMG 2574
IMG 2574
1
1
IMG 2576
IMG 2576
IMG 2578
IMG 2578

Themes of the summit

In case of 5G, we have seen a huge opportunity in discussing PANTHEON.tech’s future involvement and plans in this revolution. The challenges surrounding 5G were discussed by industry leaders with hands-on experience. This was beneficial, since we were confronted with the harsh reality of 5G. Due to it being a technology in-progress, many questions are still open. What will be the use-cases? What should we prepare for and when?

Nobody really knows how it may turn out, when it will become widely available for consumers, or if the world is even prepared for it. But it was a great opportunity to meet the people, whose bread and butter consists of building the future 5G network. It was an invaluable experience, to see a realistic view from industry-insiders and their perception of the future. It was a collective of equally-minded individuals and companies in the fields relevant to PANTHEON.tech’s vision.

Another heavily discussed topic was security. While it is no secret that technology is successfully becoming an important part of our lives. Companies have to heavily rely on a defense against potential security threats and cyber attacks. Panels were held regarding the importance of security measures in expanding networks and the need for flexible and agile security solutions.

Subsequently, Edge Computing, which brings the distribution of data closer to the consumer, was also mentioned and discussed, in regards to its vulnerabilities and future. In this case, it was said with certainty that if you are the type of parent that plans your child’s future for them, make them study cyber security. The investment will return sooner than you could imagine.

Our experience at the summit

Our vision in attending this summit was to find out, if this summit is the right fit for us (spoiler alert – it was) check on the newest trends in our field and in which direction are they developing. The discussions were open and involved the real thoughts and views, without the PR and marketing stuff.

Lisbon is an interesting city, since it is more hidden from the eye of a classic tourist. It reminded me, in a way, of San Francisco. This was mainly due to trams riding uphill and the many uphill roads one has to take, in order to get somewhere. It was surprising though, that the city is making it a point to keep the original architecture of the city in tact and without major reconstructions.

As for the venue itself, the Intercontinental Hotel in Lisbon was nothing short of wonderful. Another highlight was the gala dinner. It was the perfect opportunity for casual networking, in the pompous and spectacular setting of Palacio de Xebregas. I have also experienced my first tuk-tuk ride, where I had to consider whether my life was worth the visit.

In conclusion – it was. I am looking forward to the new business-partners and connections PANTHEON.tech has made at the 2020 Vision Executive Summit.


You can contact us at https://pantheon.tech/

Explore our Pantheon GitHub.

Watch our YouTube Channel.
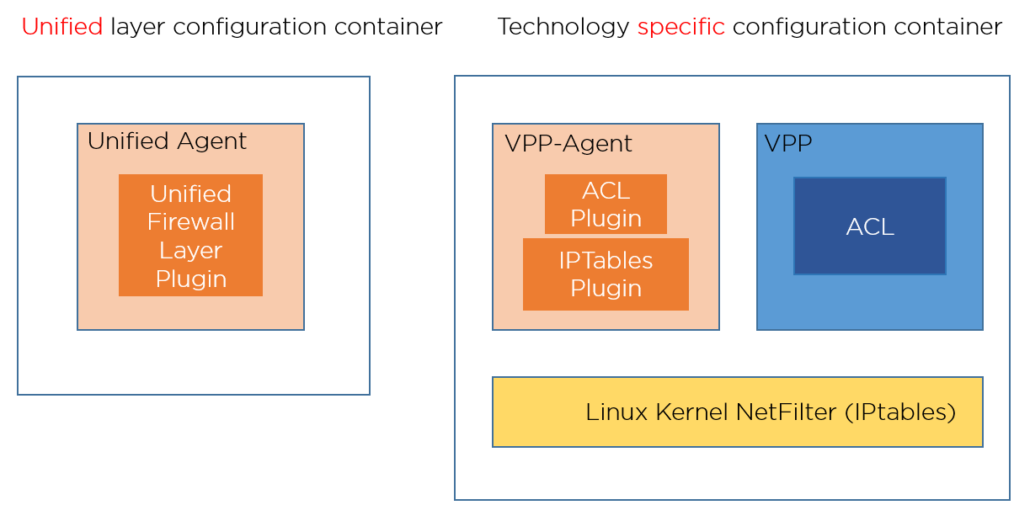
Page 4 of 6«‹23456›»

More @ PATHEON.tech

  • [What Is] VLAN & VXLAN
  • [What Is] Whitebox Networking?
  • [What Is] BGP EVPN?
© 2025 PANTHEON.tech s.r.o | Privacy Policy | Cookie Policy
  • Link to LinkedIn
  • Link to Youtube
  • Link to X
  • Link to Instagram
Manage Consent
To provide the best experiences, we use technologies like cookies to store and/or access device information. Consenting to these technologies will allow us to process data such as browsing behavior or unique IDs on this site. Not consenting or withdrawing consent, may adversely affect certain features and functions.
Functional Always active
The technical storage or access is strictly necessary for the legitimate purpose of enabling the use of a specific service explicitly requested by the subscriber or user, or for the sole purpose of carrying out the transmission of a communication over an electronic communications network.
Preferences
The technical storage or access is necessary for the legitimate purpose of storing preferences that are not requested by the subscriber or user.
Statistics
The technical storage or access that is used exclusively for statistical purposes. The technical storage or access that is used exclusively for anonymous statistical purposes. Without a subpoena, voluntary compliance on the part of your Internet Service Provider, or additional records from a third party, information stored or retrieved for this purpose alone cannot usually be used to identify you.
Marketing
The technical storage or access is required to create user profiles to send advertising, or to track the user on a website or across several websites for similar marketing purposes.
Manage options Manage services Manage {vendor_count} vendors Read more about these purposes
View preferences
{title} {title} {title}
Scroll to top